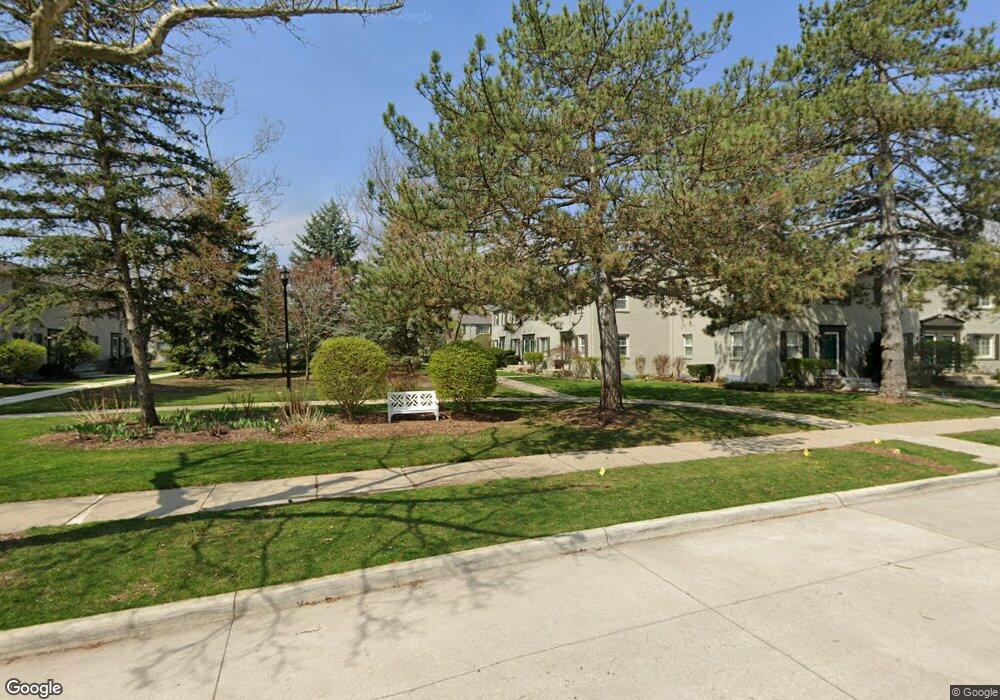
1646 Graefield Rd Unit Bldg-Unit Birmingham, MI 48009
Estimated Value: $226,744 - $266,000
2
Beds
1
Bath
925
Sq Ft
$272/Sq Ft
Est. Value
About This Home
This home is located at 1646 Graefield Rd Unit Bldg-Unit, Birmingham, MI 48009 and is currently estimated at $251,186, approximately $271 per square foot. 1646 Graefield Rd Unit Bldg-Unit is a home located in Oakland County with nearby schools including Pembroke Elementary School, Derby Middle School, and Ernest W. Seaholm High School.
Ownership History
Date
Name
Owned For
Owner Type
Purchase Details
Closed on
Mar 20, 2018
Sold by
Jenkins Krista L and Gauchey Krista L
Bought by
Hockenberger Erin
Current Estimated Value
Home Financials for this Owner
Home Financials are based on the most recent Mortgage that was taken out on this home.
Interest Rate
4.44%
Purchase Details
Closed on
Sep 24, 2002
Sold by
Grundland Dayna
Bought by
Russell Peter G
Purchase Details
Closed on
Aug 4, 2000
Sold by
Miller Suzanne C
Bought by
Grundland Dayna
Purchase Details
Closed on
Oct 17, 1995
Sold by
Sparks Wendy S
Bought by
Miller Suzanne C
Home Financials for this Owner
Home Financials are based on the most recent Mortgage that was taken out on this home.
Original Mortgage
$68,800
Interest Rate
7.65%
Create a Home Valuation Report for This Property
The Home Valuation Report is an in-depth analysis detailing your home's value as well as a comparison with similar homes in the area
Home Values in the Area
Average Home Value in this Area
Purchase History
| Date | Buyer | Sale Price | Title Company |
|---|---|---|---|
| Hockenberger Erin | $159,000 | -- | |
| Russell Peter G | $145,000 | -- | |
| Grundland Dayna | $145,000 | -- | |
| Miller Suzanne C | $86,000 | -- |
Source: Public Records
Mortgage History
| Date | Status | Borrower | Loan Amount |
|---|---|---|---|
| Closed | Hockenberger Erin | -- | |
| Previous Owner | Miller Suzanne C | $68,800 | |
| Closed | Grundland Dayna | -- |
Source: Public Records
Tax History Compared to Growth
Tax History
| Year | Tax Paid | Tax Assessment Tax Assessment Total Assessment is a certain percentage of the fair market value that is determined by local assessors to be the total taxable value of land and additions on the property. | Land | Improvement |
|---|---|---|---|---|
| 2024 | $3,051 | $98,560 | $0 | $0 |
| 2023 | $2,924 | $93,030 | $0 | $0 |
| 2022 | $3,135 | $86,380 | $0 | $0 |
| 2021 | $3,163 | $84,430 | $0 | $0 |
| 2020 | $2,818 | $82,660 | $0 | $0 |
| 2019 | $3,190 | $76,150 | $0 | $0 |
| 2018 | $1,435 | $66,820 | $0 | $0 |
| 2017 | $1,754 | $60,890 | $0 | $0 |
| 2016 | $1,747 | $55,420 | $0 | $0 |
| 2015 | -- | $47,780 | $0 | $0 |
| 2014 | -- | $39,950 | $0 | $0 |
| 2011 | -- | $30,090 | $0 | $0 |
Source: Public Records
Map
Nearby Homes
- 1724 Graefield Rd
- 729 N Eton St
- 2100 Derby Rd
- 1509 Yorkshire Rd
- 2180 Derby Rd
- 878 Brooklawn Dr
- 2263 Manchester Rd
- 1180 Manchester Rd
- 1225 Derby Rd Unit 1
- 850 N Adams Rd
- 998 Brooklawn Dr
- 1060 Wimbleton Dr
- 1751 Villa Rd
- 1119 E Maple Rd
- 000 N Adams Rd
- 2051 Villa Rd Unit 304
- 2051 Villa Rd Unit 302
- 1777 Hazel St
- 2873 Summers Place
- 1673 Hazel St
- 1660 Graefield Rd Unit 1660
- 730 Graefield Ct Unit 151
- 660 Graefield Ct Unit 170
- 1735 Graefield Rd Unit 117
- 1756 Graefield Rd Unit Bldg-Unit
- 1744 Graefield Rd Unit Bldg-Unit
- 1734 Graefield Rd Unit Bldg-Unit
- 1684 Graefield Rd Unit 307, 60
- 696 Graefield Ct Unit 167
- 660 Graefield Ct Unit 170
- 1866 Graefield Rd Unit 8
- 633 Graefield Ct Unit 128
- 1602 Graefield Rd
- 1604 Graefield Rd Unit 90
- 1608 Graefield Rd Unit 89
- 1610 Graefield Rd Unit 88
- 1612 Graefield Rd
- 1616 Graefield Rd Unit 86
- 1618 Graefield Rd
- 1620 Graefield Rd Unit 84