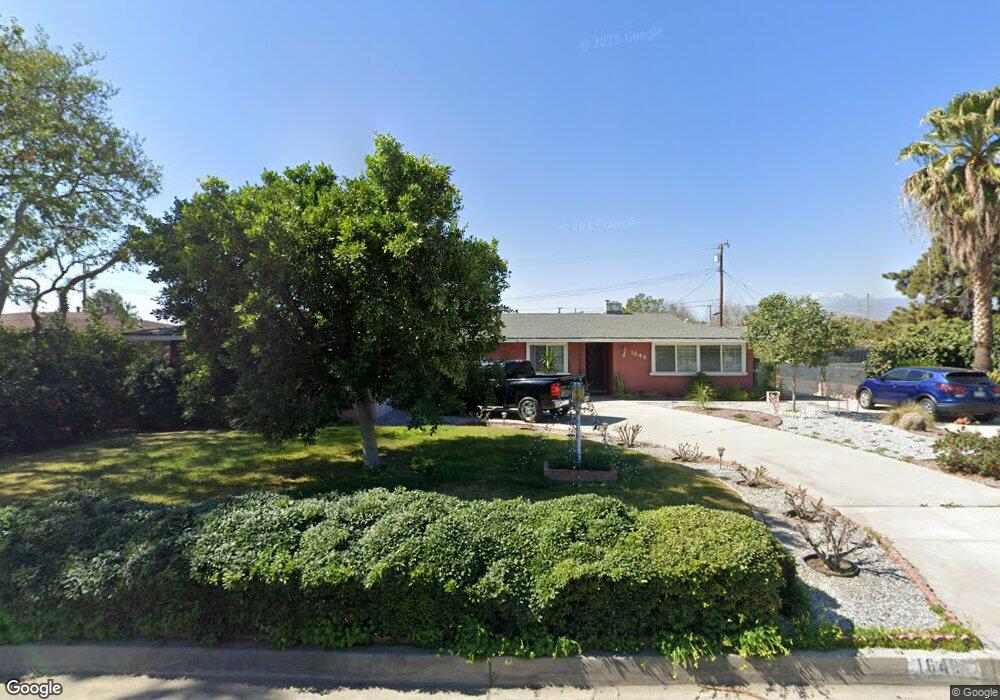
1646 N Encina Ave Rialto, CA 92376
Estimated Value: $569,000 - $636,000
4
Beds
2
Baths
1,705
Sq Ft
$350/Sq Ft
Est. Value
About This Home
This home is located at 1646 N Encina Ave, Rialto, CA 92376 and is currently estimated at $596,215, approximately $349 per square foot. 1646 N Encina Ave is a home located in San Bernardino County with nearby schools including Morgan Elementary School, Frisbie Middle School, and Wilmer Amina Carter High School.
Ownership History
Date
Name
Owned For
Owner Type
Purchase Details
Closed on
Mar 20, 2015
Sold by
Reynoso Maclovio and Reynoso Osvaldo S
Bought by
Reynoso Osvaldo S
Current Estimated Value
Home Financials for this Owner
Home Financials are based on the most recent Mortgage that was taken out on this home.
Original Mortgage
$197,000
Outstanding Balance
$151,327
Interest Rate
3.76%
Mortgage Type
New Conventional
Estimated Equity
$444,888
Purchase Details
Closed on
Sep 20, 2002
Sold by
Reynoso Maria Cecilia and Reynoso Rosa Isela
Bought by
Reynoso Maclovio and Reynoso Osvaldo S
Home Financials for this Owner
Home Financials are based on the most recent Mortgage that was taken out on this home.
Original Mortgage
$107,250
Interest Rate
6.16%
Purchase Details
Closed on
Apr 29, 1994
Sold by
Reynoso Jabier
Bought by
Reynoso Maclovio and Reynoso Osvaldo S
Create a Home Valuation Report for This Property
The Home Valuation Report is an in-depth analysis detailing your home's value as well as a comparison with similar homes in the area
Home Values in the Area
Average Home Value in this Area
Purchase History
| Date | Buyer | Sale Price | Title Company |
|---|---|---|---|
| Reynoso Osvaldo S | -- | North American Title Company | |
| Reynoso Maclovio | -- | Landsafe Title | |
| Reynoso Maclovio | -- | -- |
Source: Public Records
Mortgage History
| Date | Status | Borrower | Loan Amount |
|---|---|---|---|
| Open | Reynoso Osvaldo S | $197,000 | |
| Closed | Reynoso Maclovio | $107,250 |
Source: Public Records
Tax History Compared to Growth
Tax History
| Year | Tax Paid | Tax Assessment Tax Assessment Total Assessment is a certain percentage of the fair market value that is determined by local assessors to be the total taxable value of land and additions on the property. | Land | Improvement |
|---|---|---|---|---|
| 2025 | $3,714 | $282,519 | $85,720 | $196,799 |
| 2024 | $3,714 | $276,979 | $84,039 | $192,940 |
| 2023 | $3,934 | $271,548 | $82,391 | $189,157 |
| 2022 | $3,642 | $266,223 | $80,775 | $185,448 |
| 2021 | $3,619 | $261,003 | $79,191 | $181,812 |
| 2020 | $3,630 | $258,327 | $78,379 | $179,948 |
| 2019 | $3,553 | $253,262 | $76,842 | $176,420 |
| 2018 | $3,436 | $248,296 | $75,335 | $172,961 |
| 2017 | $3,411 | $243,428 | $73,858 | $169,570 |
| 2016 | $3,036 | $238,655 | $72,410 | $166,245 |
| 2015 | $2,507 | $194,166 | $50,493 | $143,673 |
| 2014 | $2,356 | $190,363 | $49,504 | $140,859 |
Source: Public Records
Map
Nearby Homes
- 1788 N Acacia Ave
- 358 E Walnut Ave
- 1465 N Eucalyptus Ave
- 454 E Mariposa Dr
- 1973 N Sage Ave
- 1407 Terrace Rd
- 160 W Cascade Dr
- 843 E Mesa Dr
- 178 W Walnut Ave Unit D
- 178 W Walnut Ave Unit C
- 249 E Jackson St
- 1005 N Encina Ave
- 917 E Jackson St
- 0 N Acacia Ave Unit CV25094258
- 153 E Jackson St
- 1032 N Sycamore Ave
- 1014 E Jackson St
- 991 N Magnolia Ave
- 301 W Easton St
- 1839 N Millard Ave
- 1630 N Encina Ave
- 1660 N Encina Ave
- 543 E Heather St
- 1641 N Encina Ave
- 1616 N Encina Ave
- 1657 N Encina Ave
- 1627 N Encina Ave
- 529 E Heather St
- 1613 N Encina Ave
- 558 E Heather St
- 1673 N Encina Ave
- 1656 N Primrose Rialto
- 1642 N Primrose Ave
- 1656 N Primrose Ave
- 544 E Heather St
- 513 E Heather St
- 574 E Heather St
- 1628 N Primrose Ave
- 1670 N Primrose Ave
- 528 E Heather St