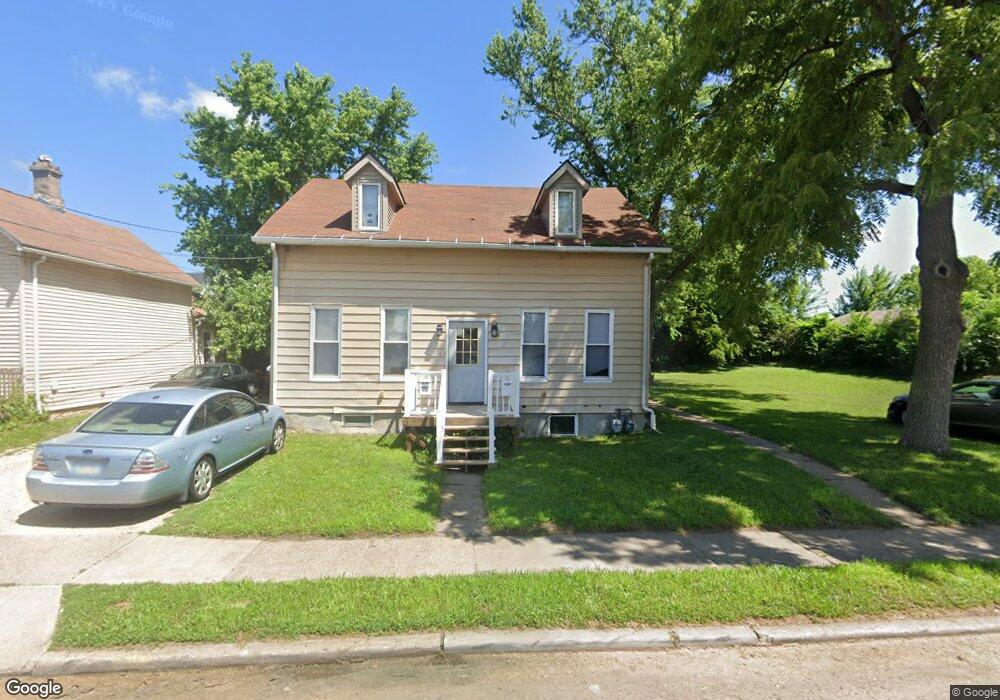
1646 W 2nd St Davenport, IA 52802
Downtown Davenport NeighborhoodEstimated Value: $65,000 - $84,846
4
Beds
2
Baths
1,746
Sq Ft
$42/Sq Ft
Est. Value
About This Home
This home is located at 1646 W 2nd St, Davenport, IA 52802 and is currently estimated at $73,712, approximately $42 per square foot. 1646 W 2nd St is a home located in Scott County with nearby schools including Walnut Hill Elementary School, South Christian Elementary School, and Christian County Middle School.
Ownership History
Date
Name
Owned For
Owner Type
Purchase Details
Closed on
Oct 31, 2014
Sold by
Callison Carl L and Callison Cheryl R
Bought by
Leetch Gregory A and Leech Gregory A
Current Estimated Value
Home Financials for this Owner
Home Financials are based on the most recent Mortgage that was taken out on this home.
Original Mortgage
$30,000
Interest Rate
4.21%
Mortgage Type
New Conventional
Purchase Details
Closed on
Sep 1, 2005
Sold by
Callison Carl L and Callison Cheryl R
Bought by
Leech Gregory A
Create a Home Valuation Report for This Property
The Home Valuation Report is an in-depth analysis detailing your home's value as well as a comparison with similar homes in the area
Home Values in the Area
Average Home Value in this Area
Purchase History
| Date | Buyer | Sale Price | Title Company |
|---|---|---|---|
| Leetch Gregory A | $40,000 | None Available | |
| Leech Gregory A | $40,000 | None Available |
Source: Public Records
Mortgage History
| Date | Status | Borrower | Loan Amount |
|---|---|---|---|
| Closed | Leetch Gregory A | $30,000 | |
| Closed | Leech Gregory A | $0 |
Source: Public Records
Tax History Compared to Growth
Tax History
| Year | Tax Paid | Tax Assessment Tax Assessment Total Assessment is a certain percentage of the fair market value that is determined by local assessors to be the total taxable value of land and additions on the property. | Land | Improvement |
|---|---|---|---|---|
| 2025 | $984 | $67,640 | $4,640 | $63,000 |
| 2024 | $960 | $55,040 | $4,640 | $50,400 |
| 2023 | $1,635 | $55,040 | $4,640 | $50,400 |
| 2022 | $1,467 | $59,660 | $4,640 | $55,020 |
| 2021 | $1,280 | $59,660 | $4,640 | $55,020 |
| 2020 | $1,399 | $57,040 | $4,640 | $52,400 |
| 2019 | $1,386 | $54,420 | $4,640 | $49,780 |
| 2018 | $1,650 | $54,420 | $4,640 | $49,780 |
| 2017 | $2,226 | $51,800 | $4,640 | $47,160 |
| 2016 | $1,465 | $49,180 | $0 | $0 |
| 2015 | $1,078 | $42,250 | $0 | $0 |
| 2014 | $938 | $42,250 | $0 | $0 |
| 2013 | $922 | $0 | $0 | $0 |
| 2012 | -- | $34,370 | $3,520 | $30,850 |
Source: Public Records
Map
Nearby Homes