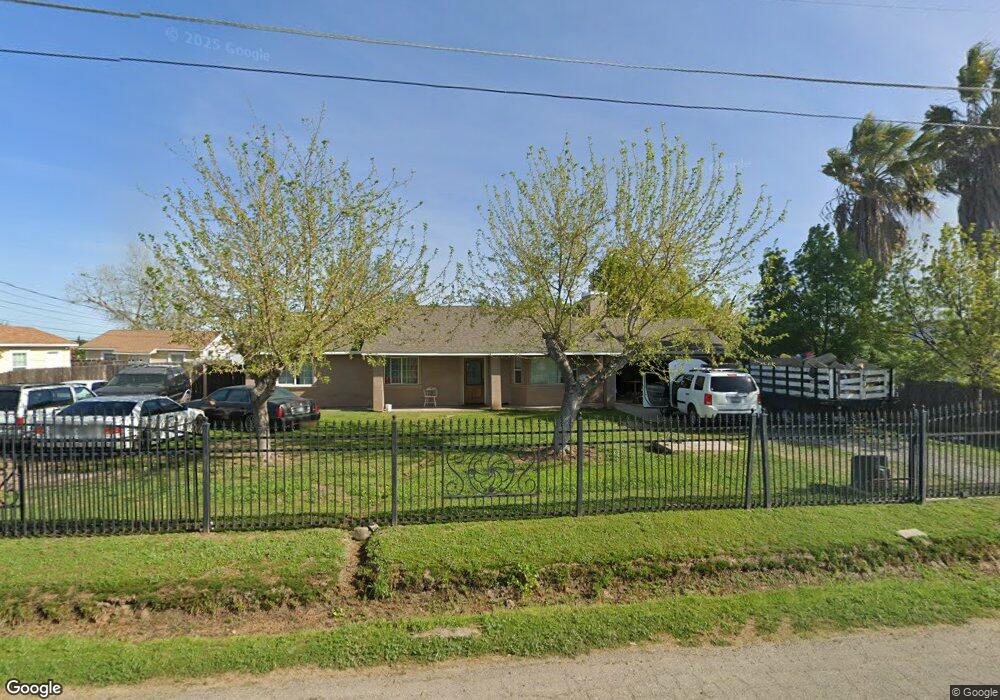
1647 Lacava Rd Merced, CA 95348
Estimated Value: $318,000 - $395,626
3
Beds
2
Baths
1,298
Sq Ft
$276/Sq Ft
Est. Value
About This Home
This home is located at 1647 Lacava Rd, Merced, CA 95348 and is currently estimated at $358,657, approximately $276 per square foot. 1647 Lacava Rd is a home located in Merced County with nearby schools including Franklin Elementary School, Herbert H. Cruickshank Middle School, and El Capitan High School.
Ownership History
Date
Name
Owned For
Owner Type
Purchase Details
Closed on
Feb 28, 2017
Sold by
Gort Joann K
Bought by
Gort Joann K and Joann K Gort Trust
Current Estimated Value
Purchase Details
Closed on
Sep 6, 2011
Sold by
Premier Acquisitions Llc
Bought by
Gort Alden D and Gort Joann K
Purchase Details
Closed on
Jun 1, 2011
Sold by
Noakes Charles E and Noakes Geraldine A
Bought by
Premier Acquisitions Llc
Purchase Details
Closed on
Aug 31, 2000
Sold by
Hud
Bought by
Noakes Charles E and Noakes Geraldine A
Home Financials for this Owner
Home Financials are based on the most recent Mortgage that was taken out on this home.
Original Mortgage
$81,350
Interest Rate
8.2%
Purchase Details
Closed on
Jun 9, 2000
Sold by
Chase Manhattan Mtg Corp
Bought by
Hud
Purchase Details
Closed on
Apr 24, 2000
Sold by
Xiong Koua and Xiong Youa Yang
Bought by
Chase Manhattan Mtg Corp
Create a Home Valuation Report for This Property
The Home Valuation Report is an in-depth analysis detailing your home's value as well as a comparison with similar homes in the area
Purchase History
| Date | Buyer | Sale Price | Title Company |
|---|---|---|---|
| Gort Joann K | -- | None Available | |
| Gort Alden D | $120,000 | Transcounty Title Company | |
| Premier Acquisitions Llc | $80,001 | None Available | |
| Noakes Charles E | $86,000 | North American Title Co | |
| Hud | -- | First American Title Ins Co | |
| Chase Manhattan Mtg Corp | $100,953 | First American Title Ins Co |
Source: Public Records
Mortgage History
| Date | Status | Borrower | Loan Amount |
|---|---|---|---|
| Previous Owner | Noakes Charles E | $81,350 |
Source: Public Records
Tax History
| Year | Tax Paid | Tax Assessment Tax Assessment Total Assessment is a certain percentage of the fair market value that is determined by local assessors to be the total taxable value of land and additions on the property. | Land | Improvement |
|---|---|---|---|---|
| 2025 | $1,517 | $150,713 | $25,114 | $125,599 |
| 2024 | $1,517 | $147,759 | $24,622 | $123,137 |
| 2023 | $1,494 | $144,863 | $24,140 | $120,723 |
| 2022 | $1,472 | $142,023 | $23,667 | $118,356 |
| 2021 | $1,468 | $139,239 | $23,203 | $116,036 |
| 2020 | $1,477 | $137,813 | $22,966 | $114,847 |
| 2019 | $1,455 | $135,112 | $22,516 | $112,596 |
| 2018 | $1,325 | $132,464 | $22,075 | $110,389 |
| 2017 | $1,373 | $129,868 | $21,643 | $108,225 |
| 2016 | $1,351 | $127,322 | $21,219 | $106,103 |
| 2015 | $1,328 | $125,411 | $20,901 | $104,510 |
| 2014 | $1,298 | $122,955 | $20,492 | $102,463 |
Source: Public Records
Map
Nearby Homes
- 4032 Wood Creek Ct
- 1378 Cassis Dr
- 1258 Avignon Dr
- 4119 Anise Ct
- 3622 N State Highway 59
- 4162 Clary Ct
- 1277 Baxter Dr
- 4170 Clary Ct
- 1227 Cavalaire Ct
- 3749 Morningside Ave
- 3742 Morningside Ave
- 1361 Carlsbad Dr
- 1207 Day Light Dr
- 1338 Hermosa Dr
- 3910 Twilight Ave
- 3759 Larkspur Ave
- 3758 Larkspur Ave
- 3583 Sarasota Ave
- 4246 Freemark Ave
- 1151 Mazatlan Place
- 1653 Lacava Rd
- 1635 Lacava Rd
- 1663 Lacava Rd
- 1625 Lacava Rd
- 1666 Pettinotti Rd
- 1671 Lacava Rd
- 1628 Lacava Rd
- 1662 Pettinotti Rd
- 1672 Pettinotti Rd
- 1615 Lacava Rd
- 1646 Pettinotti Rd
- 3842 N State Highway 59
- 1634 Pettinotti Rd
- 1562 Pettinotti Rd
- 3848 N State Highway 59
- 1682 Pettinotti Rd
- 1601 Lacava Rd
- 1604 Pettinotti Rd
- 15120 N State Highway 59
- 1592 Pettinotti Rd
Your Personal Tour Guide
Ask me questions while you tour the home.