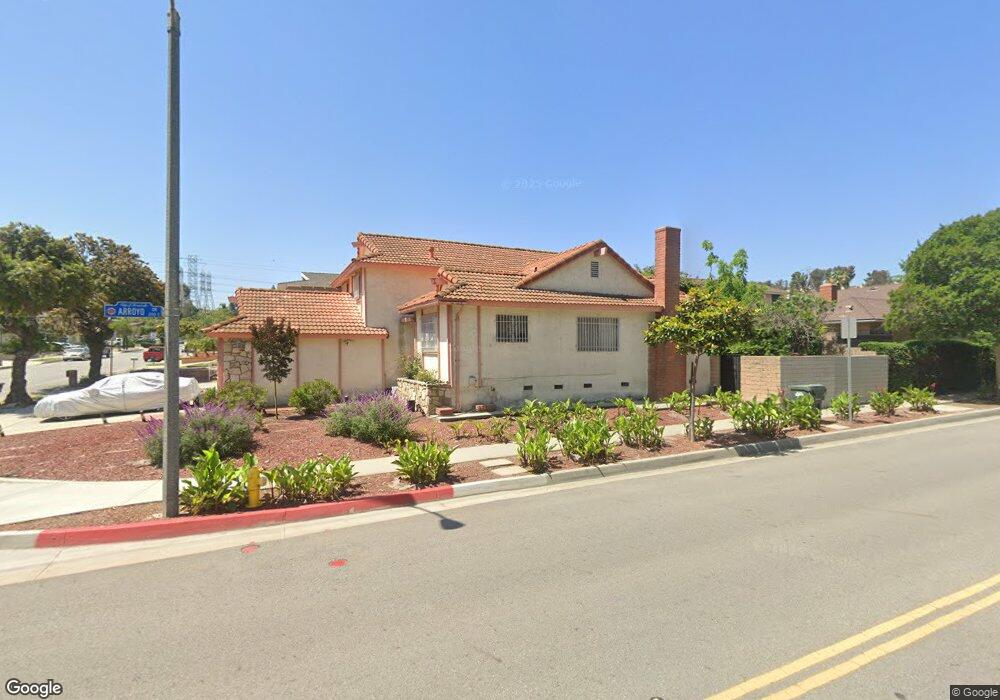
1647 N Ironstone Ave Montebello, CA 90640
Estimated Value: $905,240 - $1,025,000
4
Beds
3
Baths
2,079
Sq Ft
$467/Sq Ft
Est. Value
About This Home
This home is located at 1647 N Ironstone Ave, Montebello, CA 90640 and is currently estimated at $971,310, approximately $467 per square foot. 1647 N Ironstone Ave is a home located in Los Angeles County with nearby schools including Potrero Heights Elementary School, Macy Intermediate School, and Schurr High School.
Ownership History
Date
Name
Owned For
Owner Type
Purchase Details
Closed on
Feb 25, 2023
Sold by
Berry Lou
Bought by
Berry Lou Living Trust
Current Estimated Value
Purchase Details
Closed on
Jan 26, 2010
Sold by
Lou Berry and Danny & Margaret Lou Revocable
Bought by
Lou Berry
Purchase Details
Closed on
Oct 26, 2006
Sold by
Lou Berry and Lou Margaret
Bought by
Lou Berry
Home Financials for this Owner
Home Financials are based on the most recent Mortgage that was taken out on this home.
Original Mortgage
$247,900
Interest Rate
6.39%
Mortgage Type
Credit Line Revolving
Purchase Details
Closed on
Mar 1, 2006
Sold by
Lou Margaret and Danny & Margaret Lou Revocable
Bought by
Lou Margaret and Danny & Margaret Lou Revocable Living Tr
Purchase Details
Closed on
Sep 19, 2005
Sold by
Lou Danny and Lou Margaret
Bought by
Lou Danny
Create a Home Valuation Report for This Property
The Home Valuation Report is an in-depth analysis detailing your home's value as well as a comparison with similar homes in the area
Home Values in the Area
Average Home Value in this Area
Purchase History
| Date | Buyer | Sale Price | Title Company |
|---|---|---|---|
| Berry Lou Living Trust | -- | -- | |
| Lou Berry | -- | None Available | |
| Lou Berry | -- | Southland Title | |
| Lou Margaret | -- | None Available | |
| Lou Danny | -- | -- |
Source: Public Records
Mortgage History
| Date | Status | Borrower | Loan Amount |
|---|---|---|---|
| Previous Owner | Lou Berry | $247,900 |
Source: Public Records
Tax History Compared to Growth
Tax History
| Year | Tax Paid | Tax Assessment Tax Assessment Total Assessment is a certain percentage of the fair market value that is determined by local assessors to be the total taxable value of land and additions on the property. | Land | Improvement |
|---|---|---|---|---|
| 2025 | $4,082 | $245,727 | $98,243 | $147,484 |
| 2024 | $4,082 | $240,910 | $96,317 | $144,593 |
| 2023 | $4,063 | $236,187 | $94,429 | $141,758 |
| 2022 | $3,927 | $231,557 | $92,578 | $138,979 |
| 2021 | $3,777 | $227,017 | $90,763 | $136,254 |
| 2019 | $3,603 | $220,285 | $88,072 | $132,213 |
| 2018 | $3,620 | $215,967 | $86,346 | $129,621 |
| 2016 | $3,457 | $207,583 | $82,994 | $124,589 |
| 2015 | $3,286 | $204,466 | $81,748 | $122,718 |
| 2014 | $3,248 | $200,462 | $80,147 | $120,315 |
Source: Public Records
Map
Nearby Homes
- 598 Alder Way
- 185 Orchid Ct
- 1603 Firvale Ave
- 1728 Mountain Terrace Ln
- 1735 Mountain Terrace Ln Unit 73
- 1620 Neil Armstrong St Unit 306
- 1610 Neil Armstrong St Unit 313
- 1610 Neil Armstrong St Unit 304
- 1725 Neil Armstrong St Unit 103
- 1765 Neil Armstrong St Unit 202
- 1661 Neil Armstrong St Unit 246
- 1661 Neil Armstrong St Unit 129
- 8531 El Camino Dr
- 8580 Village Ln
- 1045 Walnut Grove Ave
- 0 Montebello Blvd
- 1315 Snowberry Place
- 1265 Snowberry Place
- 1245 Snowberry Place
- 1275 Snowberry Place
- 1643 N Ironstone Ave
- 1652 Hanging Rock Ave
- 1639 N Ironstone Ave
- 1648 Hanging Rock Ave
- 1644 Hanging Rock Ave
- 1635 N Ironstone Ave
- 1644 N Ironstone Ave
- 1640 N Ironstone Ave
- 1640 Hanging Rock Ave
- 1636 N Ironstone Ave
- 1631 N Ironstone Ave
- 1632 N Ironstone Ave
- 1636 Hanging Rock Ave
- 163 E Arroyo Dr
- 775 Alder Way
- 588 Alder Way
- 628 Alder Way
- 655 Alder Way
- 675 Alder Way
- 665 Alder Way