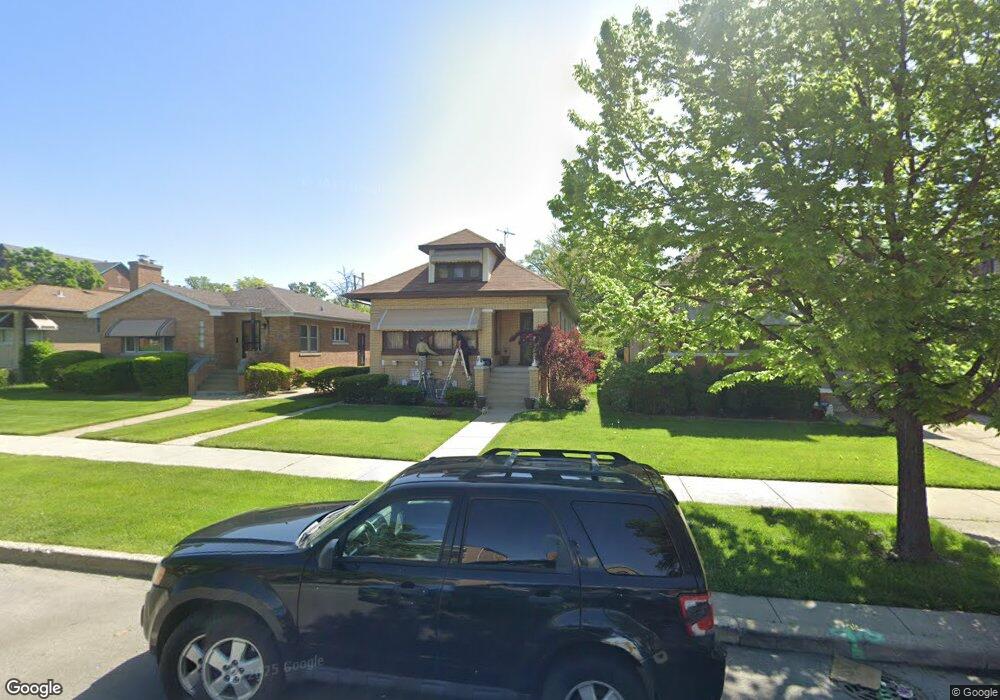
1647 N Narragansett Ave Chicago, IL 60639
Galewood NeighborhoodEstimated Value: $348,220 - $414,000
3
Beds
1
Bath
1,556
Sq Ft
$242/Sq Ft
Est. Value
About This Home
This home is located at 1647 N Narragansett Ave, Chicago, IL 60639 and is currently estimated at $376,055, approximately $241 per square foot. 1647 N Narragansett Ave is a home located in Cook County with nearby schools including Lovett Elementary School, Steinmetz College Prep, and Acero - Roberto Clemente Elementary School.
Ownership History
Date
Name
Owned For
Owner Type
Purchase Details
Closed on
Jul 30, 2001
Sold by
Crowder Sheila
Bought by
Crowder Sheila and Crowder Jacqueline
Current Estimated Value
Home Financials for this Owner
Home Financials are based on the most recent Mortgage that was taken out on this home.
Original Mortgage
$165,300
Outstanding Balance
$77,727
Interest Rate
10.05%
Estimated Equity
$298,328
Purchase Details
Closed on
Jul 9, 1999
Sold by
Crowder Shelia and Crowder Willie E
Bought by
Crowder Sheila
Home Financials for this Owner
Home Financials are based on the most recent Mortgage that was taken out on this home.
Original Mortgage
$129,200
Interest Rate
10.62%
Purchase Details
Closed on
Feb 11, 1994
Sold by
Fedele Joseph
Bought by
Crowder Shiela and Crowder Willie E
Create a Home Valuation Report for This Property
The Home Valuation Report is an in-depth analysis detailing your home's value as well as a comparison with similar homes in the area
Home Values in the Area
Average Home Value in this Area
Purchase History
| Date | Buyer | Sale Price | Title Company |
|---|---|---|---|
| Crowder Sheila | -- | -- | |
| Crowder Sheila | -- | Nations Title Agency | |
| Crowder Shiela | $74,666 | -- |
Source: Public Records
Mortgage History
| Date | Status | Borrower | Loan Amount |
|---|---|---|---|
| Open | Crowder Sheila | $165,300 | |
| Closed | Crowder Sheila | $129,200 |
Source: Public Records
Tax History Compared to Growth
Tax History
| Year | Tax Paid | Tax Assessment Tax Assessment Total Assessment is a certain percentage of the fair market value that is determined by local assessors to be the total taxable value of land and additions on the property. | Land | Improvement |
|---|---|---|---|---|
| 2024 | $3,522 | $29,000 | $12,802 | $16,198 |
| 2023 | $3,412 | $20,001 | $10,110 | $9,891 |
| 2022 | $3,412 | $20,001 | $10,110 | $9,891 |
| 2021 | $3,354 | $20,000 | $10,110 | $9,890 |
| 2020 | $4,628 | $23,867 | $7,612 | $16,255 |
| 2019 | $4,642 | $26,519 | $7,612 | $18,907 |
| 2018 | $4,562 | $26,519 | $7,612 | $18,907 |
| 2017 | $3,646 | $20,305 | $6,920 | $13,385 |
| 2016 | $3,569 | $20,305 | $6,920 | $13,385 |
| 2015 | $3,242 | $20,305 | $6,920 | $13,385 |
| 2014 | $3,568 | $21,786 | $6,228 | $15,558 |
| 2013 | $3,487 | $21,786 | $6,228 | $15,558 |
Source: Public Records
Map
Nearby Homes
- 1221 Edmer Ave
- 1212 N Harvey Ave
- 1122 N Ridgeland Ave
- 1221 Hayes Ave
- 1227 N East Ave
- 1700 N Natoma Ave
- 1715 N Meade Ave
- 1639 N Normandy Ave
- 102 Le Moyne Pkwy
- 1104 Fair Oaks Ave
- 1618 N Mcvicker Ave
- 1906 N Nashville Ave
- 34 Le Moyne Pkwy
- 1115 N Taylor Ave
- 1625 N Mcvicker Ave
- 1003 Mapleton Ave
- 1657 N Austin Ave
- 1937 N Normandy Ave
- 1733 N Oak Park Ave
- 936 N Ridgeland Ave
- 1651 N Narragansett Ave
- 1643 N Narragansett Ave
- 1639 N Narragansett Ave
- 1657 N Narragansett Ave
- 1637 N Narragansett Ave
- 1633 N Narragansett Ave Unit 1W
- 1646 N Mobile Ave
- 1650 N Mobile Ave
- 1654 N Mobile Ave
- 1636 N Mobile Ave
- 1650 N Narragansett Ave
- 1640 N Narragansett Ave
- 1640 N Narragansett Ave
- 1640 N Narragansett Ave Unit 1
- 1636 N Narragansett Ave Unit 1
- 1630 N Mobile Ave
- 1654 N Narragansett Ave
- 1654 N Narragansett Ave
- 1623 N Narragansett Ave