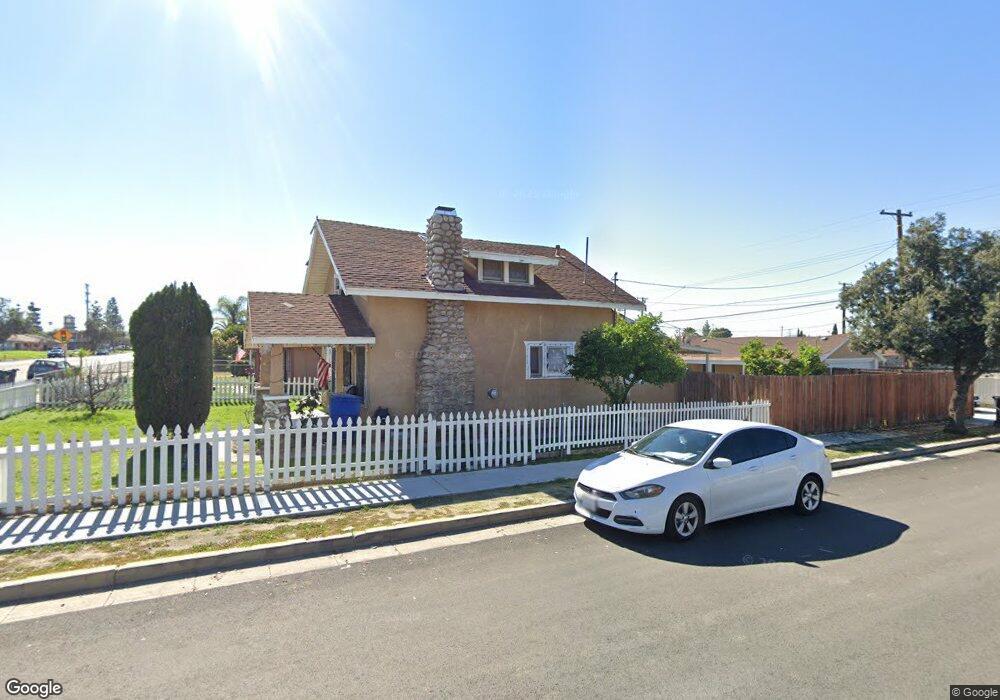
1647 Orange St Redlands, CA 92374
North Redlands NeighborhoodEstimated Value: $480,000 - $504,000
5
Beds
2
Baths
1,488
Sq Ft
$330/Sq Ft
Est. Value
About This Home
This home is located at 1647 Orange St, Redlands, CA 92374 and is currently estimated at $491,011, approximately $329 per square foot. 1647 Orange St is a home located in San Bernardino County with nearby schools including Lugonia Elementary School, Clement Middle School, and Citrus Valley High School.
Ownership History
Date
Name
Owned For
Owner Type
Purchase Details
Closed on
Sep 24, 2021
Sold by
Desai Navnit C and Desai Dharmishta N
Bought by
Navnit Desai Sfr Borrower Llc
Current Estimated Value
Home Financials for this Owner
Home Financials are based on the most recent Mortgage that was taken out on this home.
Original Mortgage
$1,669,000
Outstanding Balance
$1,518,666
Interest Rate
2.8%
Mortgage Type
Commercial
Estimated Equity
-$1,027,655
Purchase Details
Closed on
Jan 23, 2017
Sold by
Desai Navnitbhal C and Desai Dharmishta N
Bought by
Desai Navnitbhai C and Desal Dharmishta N
Purchase Details
Closed on
Feb 10, 2010
Sold by
Acquisition Investments Inc
Bought by
Desai Navnit C and Desai Dharmishta N
Purchase Details
Closed on
Feb 1, 2010
Sold by
Wells Fargo Bank Na
Bought by
Acquisition Investments Inc
Purchase Details
Closed on
Nov 27, 2009
Sold by
Cortes Otilio Ramirez
Bought by
Wachovia Bank Fsb
Purchase Details
Closed on
Apr 5, 2007
Sold by
Gomez Maria Delosremedios Islas
Bought by
Cortes Otilio Ramirez
Home Financials for this Owner
Home Financials are based on the most recent Mortgage that was taken out on this home.
Original Mortgage
$243,000
Interest Rate
6.13%
Mortgage Type
New Conventional
Purchase Details
Closed on
Oct 12, 2004
Sold by
Unson Jose and Unson Elsa
Bought by
Cortes Otilio Ramirez
Home Financials for this Owner
Home Financials are based on the most recent Mortgage that was taken out on this home.
Original Mortgage
$196,000
Interest Rate
6.15%
Mortgage Type
Purchase Money Mortgage
Purchase Details
Closed on
Apr 15, 2004
Sold by
Unson Jose and Unson Elsa
Bought by
Unson Jose and Unson Elsa
Purchase Details
Closed on
May 27, 2003
Sold by
N Star Inc
Bought by
Unson Jose and Unson Elsa
Home Financials for this Owner
Home Financials are based on the most recent Mortgage that was taken out on this home.
Original Mortgage
$144,000
Interest Rate
5.75%
Mortgage Type
Purchase Money Mortgage
Purchase Details
Closed on
May 2, 2003
Sold by
Diaz Jose Antonio
Bought by
N Star Inc
Home Financials for this Owner
Home Financials are based on the most recent Mortgage that was taken out on this home.
Original Mortgage
$144,000
Interest Rate
5.75%
Mortgage Type
Purchase Money Mortgage
Purchase Details
Closed on
Dec 23, 2002
Sold by
Murray Shari
Bought by
Diaz Jose Antonio
Purchase Details
Closed on
May 20, 2002
Sold by
James Naomi
Bought by
Moller James L
Create a Home Valuation Report for This Property
The Home Valuation Report is an in-depth analysis detailing your home's value as well as a comparison with similar homes in the area
Home Values in the Area
Average Home Value in this Area
Purchase History
| Date | Buyer | Sale Price | Title Company |
|---|---|---|---|
| Navnit Desai Sfr Borrower Llc | -- | None Available | |
| Desai Navnitbhai C | -- | Chicago Title | |
| Desai Navnit C | $92,500 | None Available | |
| Acquisition Investments Inc | $85,000 | Fidelity National Title Co | |
| Wachovia Bank Fsb | $101,200 | Accommodation | |
| Cortes Otilio Ramirez | -- | Commonwealth Land Title Co | |
| Cortes Otilio Ramirez | $245,000 | Southland Title Of Burbank | |
| Unson Jose | -- | -- | |
| Unson Jose | $160,000 | First American | |
| N Star Inc | -- | First American | |
| Diaz Jose Antonio | $90,000 | First American | |
| Moller James L | -- | -- | |
| Moller James L | -- | -- | |
| Moller James L | $7,000 | -- |
Source: Public Records
Mortgage History
| Date | Status | Borrower | Loan Amount |
|---|---|---|---|
| Open | Navnit Desai Sfr Borrower Llc | $1,669,000 | |
| Previous Owner | Cortes Otilio Ramirez | $243,000 | |
| Previous Owner | Cortes Otilio Ramirez | $196,000 | |
| Previous Owner | Unson Jose | $144,000 |
Source: Public Records
Tax History
| Year | Tax Paid | Tax Assessment Tax Assessment Total Assessment is a certain percentage of the fair market value that is determined by local assessors to be the total taxable value of land and additions on the property. | Land | Improvement |
|---|---|---|---|---|
| 2025 | $1,607 | $126,500 | $32,270 | $94,230 |
| 2024 | $1,502 | $124,019 | $31,637 | $92,382 |
| 2023 | $1,501 | $121,588 | $31,017 | $90,571 |
| 2022 | $1,480 | $119,204 | $30,409 | $88,795 |
| 2021 | $1,506 | $116,867 | $29,813 | $87,054 |
| 2020 | $1,484 | $115,668 | $29,507 | $86,161 |
| 2019 | $1,443 | $113,400 | $28,928 | $84,472 |
| 2018 | $1,408 | $111,177 | $28,361 | $82,816 |
| 2017 | $1,397 | $108,997 | $27,805 | $81,192 |
| 2016 | $1,381 | $106,860 | $27,260 | $79,600 |
| 2015 | $1,371 | $105,255 | $26,851 | $78,404 |
| 2014 | $1,347 | $103,193 | $26,325 | $76,868 |
Source: Public Records
Map
Nearby Homes
- 227 Mulvihill Ave
- 122 E Pioneer Ave
- 140 W Pioneer Ave
- 140 W Pioneer Ave Unit 38
- 140 W Pioneer Ave Unit 31
- 1602 Glover St
- 1926 Alta St
- 833 Half Moon Ave
- 1539 Robyn St
- 215 W Lugonia Ave
- 1429 Berkeley Dr
- 610 E Lugonia Ave Unit 4
- 1076 Occidental Cir
- 2040 Tangelo Ln
- 1011 Gail Ave
- 2070 Tangelo Ln
- 1322 Hunter Dr
- 2051 Tangelo Ln
- 934 Fuchsia Cir
- 2063 Tangelo Ln
- 1643 Orange St
- 1635 Orange St
- 10 Dreka Ave
- 1646 Washington St
- 1629 Orange St
- 1642 Washington St
- 1638 Washington St
- 98 Dreka Ave
- 1627 Orange St
- 1634 Orange St
- 1636 Washington St
- 1630 Orange St
- 1708 Washington St
- 1702 Orange St
- 1711 Orange St
- 1626 Orange St
- 1632 Washington St
- 1625 Orange St
- 1712 Washington St
- 1622 Orange St
Your Personal Tour Guide
Ask me questions while you tour the home.