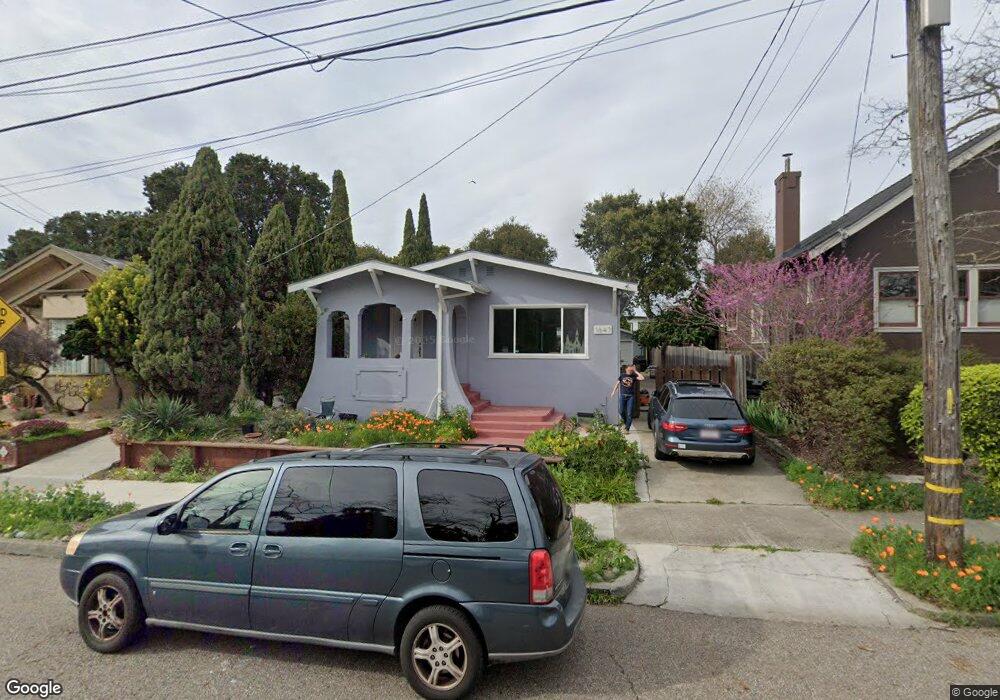
1647 Tyler St Berkeley, CA 94703
South Berkeley NeighborhoodEstimated Value: $1,169,000 - $1,410,738
3
Beds
1
Bath
1,300
Sq Ft
$1,015/Sq Ft
Est. Value
About This Home
This home is located at 1647 Tyler St, Berkeley, CA 94703 and is currently estimated at $1,319,185, approximately $1,014 per square foot. 1647 Tyler St is a home located in Alameda County with nearby schools including Malcolm X Elementary School, Emerson Elementary School, and John Muir Elementary School.
Ownership History
Date
Name
Owned For
Owner Type
Purchase Details
Closed on
May 31, 2024
Sold by
Guyton W Dumin Revocable Trust and Durnin Guyton W
Bought by
Durnin Woodward Trust and Durnin
Current Estimated Value
Purchase Details
Closed on
May 6, 2019
Sold by
Durnin Guyton William
Bought by
Guyton W Durnin Revocable Trust
Purchase Details
Closed on
Apr 26, 2019
Sold by
Guyton William Durnin Trust Of 2000
Bought by
Durnin Guyton William
Purchase Details
Closed on
Jun 5, 2018
Sold by
Cheatham Cory and Estate Of Lillie Belle Trass
Bought by
Durnin Margaret C and Durnin Charles W
Create a Home Valuation Report for This Property
The Home Valuation Report is an in-depth analysis detailing your home's value as well as a comparison with similar homes in the area
Home Values in the Area
Average Home Value in this Area
Purchase History
| Date | Buyer | Sale Price | Title Company |
|---|---|---|---|
| Durnin Woodward Trust | -- | None Listed On Document | |
| Guyton W Durnin Revocable Trust | -- | None Available | |
| Durnin Guyton William | -- | None Available | |
| Durnin Margaret C | $1,195,000 | Stewart Title Of California |
Source: Public Records
Tax History
| Year | Tax Paid | Tax Assessment Tax Assessment Total Assessment is a certain percentage of the fair market value that is determined by local assessors to be the total taxable value of land and additions on the property. | Land | Improvement |
|---|---|---|---|---|
| 2025 | $19,794 | $1,379,742 | $407,904 | $978,838 |
| 2024 | $19,794 | $1,352,551 | $399,906 | $959,645 |
| 2023 | $19,361 | $1,332,897 | $392,066 | $940,831 |
| 2022 | $19,069 | $1,306,766 | $384,380 | $922,386 |
| 2021 | $19,147 | $1,281,147 | $376,844 | $904,303 |
| 2020 | $17,615 | $1,243,277 | $372,983 | $870,294 |
| 2019 | $17,951 | $1,218,900 | $365,670 | $853,230 |
| 2018 | $4,060 | $93,563 | $61,314 | $32,249 |
| 2017 | $3,873 | $91,729 | $60,112 | $31,617 |
| 2016 | $3,642 | $89,930 | $58,933 | $30,997 |
| 2015 | $3,561 | $88,579 | $58,048 | $30,531 |
| 2014 | $3,427 | $86,845 | $56,911 | $29,934 |
Source: Public Records
Map
Nearby Homes
- 1538 Ashby Ave
- 3110 California St
- 3114 California St
- 3138 California St
- 1507 Prince St
- 2926 Ellis St
- 1535 Julia St
- 3214 California St
- 1610 Oregon St
- 3233 Ellis St
- 3224 Sacramento St
- 1530 Stuart St
- 1627 62nd St
- 2790 Sacramento St
- 2782 Sacramento St
- 2727 McGee Ave
- 1314 Ashby Ave
- 2774 Sacramento St
- 2758 Sacramento St
- 2750 Sacramento St
Your Personal Tour Guide
Ask me questions while you tour the home.