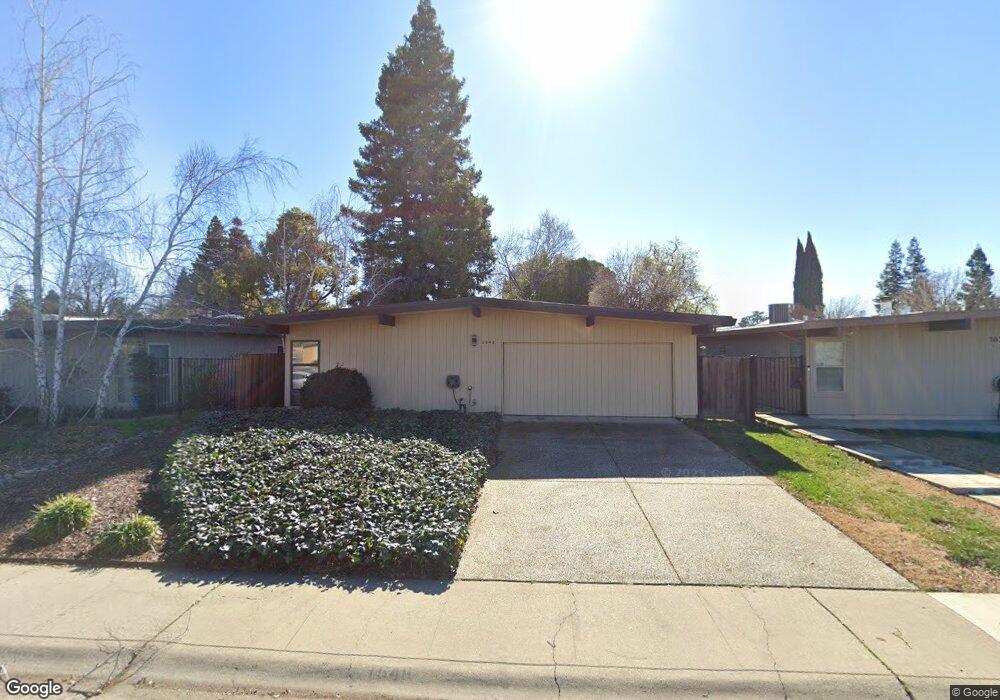
1648 Bannon Creek Dr Sacramento, CA 95833
South Natomas NeighborhoodEstimated Value: $391,000 - $454,000
3
Beds
2
Baths
1,344
Sq Ft
$317/Sq Ft
Est. Value
About This Home
This home is located at 1648 Bannon Creek Dr, Sacramento, CA 95833 and is currently estimated at $426,356, approximately $317 per square foot. 1648 Bannon Creek Dr is a home located in Sacramento County with nearby schools including Bannon Creek Elementary School, Natomas High School, and READ Academy of Sacramento.
Ownership History
Date
Name
Owned For
Owner Type
Purchase Details
Closed on
Mar 29, 2003
Sold by
Graves Schuyler
Bought by
Graves Schuyler and The Schuyler Graves Trust
Current Estimated Value
Purchase Details
Closed on
Oct 10, 1995
Sold by
Sunrise Bank Of California
Bought by
Haderman Fred W and Haderman Georgianna
Home Financials for this Owner
Home Financials are based on the most recent Mortgage that was taken out on this home.
Original Mortgage
$72,450
Interest Rate
7.8%
Purchase Details
Closed on
Jul 19, 1995
Sold by
River City Commons Assn
Bought by
Bruett Jeffrey S and Clarke George C
Purchase Details
Closed on
Jun 28, 1995
Sold by
Clarke George C and Bruett Jeffrey S
Bought by
Sunrise Bank Of California
Purchase Details
Closed on
Mar 6, 1995
Sold by
River City Commons Assn
Bought by
River City Commons Assn
Create a Home Valuation Report for This Property
The Home Valuation Report is an in-depth analysis detailing your home's value as well as a comparison with similar homes in the area
Home Values in the Area
Average Home Value in this Area
Purchase History
| Date | Buyer | Sale Price | Title Company |
|---|---|---|---|
| Graves Schuyler | -- | -- | |
| Haderman Fred W | $80,500 | Placer Title Company | |
| Bruett Jeffrey S | -- | -- | |
| Sunrise Bank Of California | -- | -- | |
| River City Commons Assn | $3,004 | First American Title Ins Co |
Source: Public Records
Mortgage History
| Date | Status | Borrower | Loan Amount |
|---|---|---|---|
| Closed | Bruett Jeffrey S | $85,600 | |
| Closed | Haderman Fred W | $72,450 |
Source: Public Records
Tax History Compared to Growth
Tax History
| Year | Tax Paid | Tax Assessment Tax Assessment Total Assessment is a certain percentage of the fair market value that is determined by local assessors to be the total taxable value of land and additions on the property. | Land | Improvement |
|---|---|---|---|---|
| 2025 | $1,997 | $138,082 | $47,884 | $90,198 |
| 2024 | $1,997 | $135,376 | $46,946 | $88,430 |
| 2023 | $1,898 | $132,723 | $46,026 | $86,697 |
| 2022 | $1,849 | $130,122 | $45,124 | $84,998 |
| 2021 | $1,854 | $127,572 | $44,240 | $83,332 |
| 2020 | $1,850 | $126,265 | $43,787 | $82,478 |
| 2019 | $1,822 | $123,790 | $42,929 | $80,861 |
| 2018 | $1,758 | $121,364 | $42,088 | $79,276 |
| 2017 | $1,718 | $118,985 | $41,263 | $77,722 |
| 2016 | $1,660 | $116,653 | $40,454 | $76,199 |
| 2015 | $1,616 | $114,902 | $39,847 | $75,055 |
| 2014 | $1,536 | $112,652 | $39,067 | $73,585 |
Source: Public Records
Map
Nearby Homes
- 1738 Bannon Creek Dr
- 15 Hoy Lake Ct
- 42 Timberwood Ct
- 34 Timberwood Ct
- 1763 Bridgecreek Dr
- 2803 Glen Arven Way
- 2178 Sandcastle Way
- 3127 Mill Oak Way
- 2407 Seamist Dr
- 30 Cedro Cir
- 1745 Teralba Way
- 1177 Athena Ave
- 350 Del Verde Cir Unit 6
- 600 Del Verde Cir Unit 2
- 1355 Senida Way
- 56 Ishi Cir
- 2872 Baronet Way
- 2897 Candido Dr
- 100 Del Verde Cir Unit 4
- 750 Del Verde Cir Unit 6
- 1642 Bannon Creek Dr
- 1654 Bannon Creek Dr
- 1636 Bannon Creek Dr
- 30 Blue Heron Ct
- 1630 Bannon Creek Dr
- 31 Inlet Ct
- 35 Inlet Ct
- 26 Blue Heron Ct
- 1666 Bannon Creek Dr
- 27 Inlet Ct
- 22 Blue Heron Ct
- 1624 Bannon Creek Dr
- 1672 Bannon Creek Dr
- 23 Inlet Ct
- 18 Blue Heron Ct
- 1618 Bannon Creek Dr
- 1678 Bannon Creek Dr
- 19 Inlet Ct
- 1612 Bannon Creek Dr