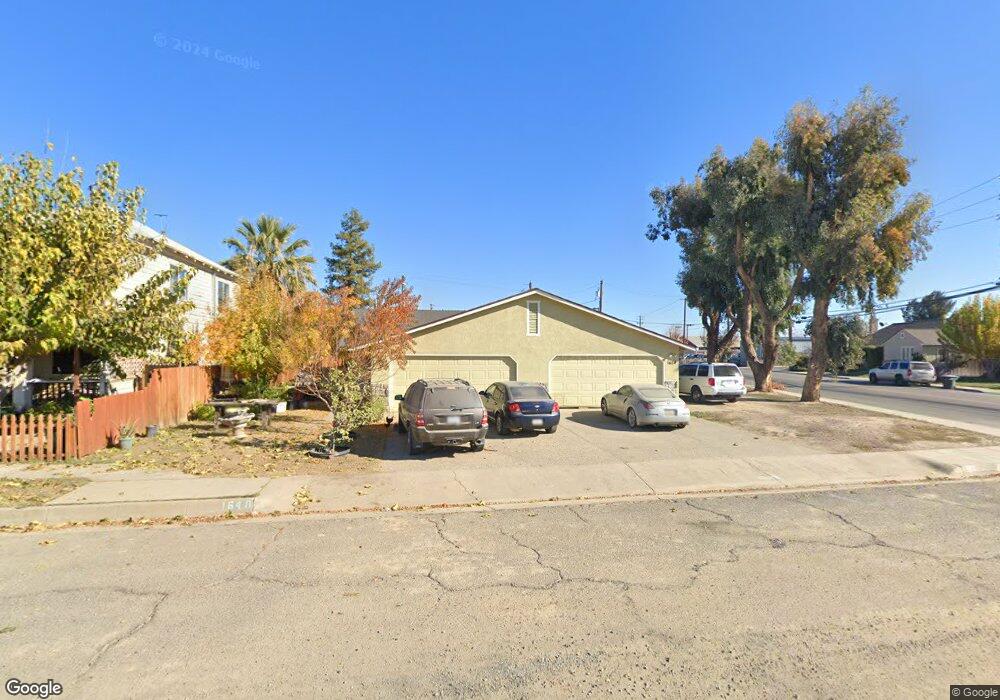
1648 Main St Newman, CA 95360
Estimated Value: $398,000 - $444,123
6
Beds
4
Baths
2,200
Sq Ft
$191/Sq Ft
Est. Value
About This Home
This home is located at 1648 Main St, Newman, CA 95360 and is currently estimated at $419,708, approximately $190 per square foot. 1648 Main St is a home with nearby schools including Orestimba High School and Our Lady of Miracles Catholic School.
Ownership History
Date
Name
Owned For
Owner Type
Purchase Details
Closed on
Oct 27, 2005
Sold by
Fernandez Rogelio and Fernandez Roselia
Bought by
Fernandez Rogelio and Fernandez Roselia
Current Estimated Value
Purchase Details
Closed on
Mar 4, 2002
Sold by
Phillips Anthony R and Phillips Christina M
Bought by
Fernandez Rogelio and Fernandez Roselia
Home Financials for this Owner
Home Financials are based on the most recent Mortgage that was taken out on this home.
Original Mortgage
$100,800
Interest Rate
6.99%
Mortgage Type
Commercial
Create a Home Valuation Report for This Property
The Home Valuation Report is an in-depth analysis detailing your home's value as well as a comparison with similar homes in the area
Home Values in the Area
Average Home Value in this Area
Purchase History
| Date | Buyer | Sale Price | Title Company |
|---|---|---|---|
| Fernandez Rogelio | -- | -- | |
| Fernandez Rogelio | $168,000 | Chicago Title Co |
Source: Public Records
Mortgage History
| Date | Status | Borrower | Loan Amount |
|---|---|---|---|
| Closed | Fernandez Rogelio | $100,800 |
Source: Public Records
Tax History
| Year | Tax Paid | Tax Assessment Tax Assessment Total Assessment is a certain percentage of the fair market value that is determined by local assessors to be the total taxable value of land and additions on the property. | Land | Improvement |
|---|---|---|---|---|
| 2025 | $2,959 | $248,163 | $59,080 | $189,083 |
| 2024 | $2,886 | $243,298 | $57,922 | $185,376 |
| 2023 | $2,808 | $238,529 | $56,787 | $181,742 |
| 2022 | $2,765 | $233,853 | $55,674 | $178,179 |
| 2021 | $2,724 | $229,269 | $54,583 | $174,686 |
| 2020 | $2,670 | $226,919 | $54,024 | $172,895 |
| 2019 | $2,683 | $222,470 | $52,965 | $169,505 |
| 2018 | $2,508 | $218,109 | $51,927 | $166,182 |
| 2017 | $2,728 | $213,833 | $50,909 | $162,924 |
| 2016 | $2,419 | $209,641 | $49,911 | $159,730 |
| 2015 | $2,496 | $206,493 | $49,162 | $157,331 |
| 2014 | $2,477 | $202,449 | $48,199 | $154,250 |
Source: Public Records
Map
Nearby Homes
Your Personal Tour Guide
Ask me questions while you tour the home.