1648 W Henderson St Cleburne, TX 76033
Osage-North Fisk NeighborhoodEstimated Value: $643,598 - $798,000
4
Beds
4
Baths
5,470
Sq Ft
$128/Sq Ft
Est. Value
About This Home
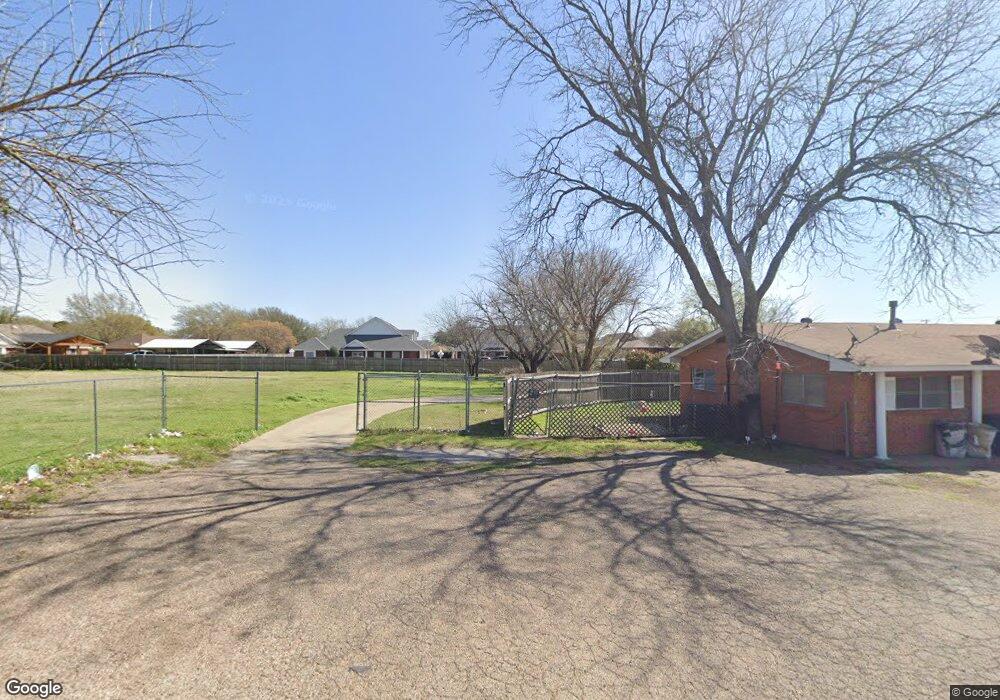
This home is located at 1648 W Henderson St, Cleburne, TX 76033 and is currently estimated at $702,650, approximately $128 per square foot. 1648 W Henderson St is a home located in Johnson County with nearby schools including Marti Elementary School, A.D. Wheat Middle School, and Cleburne High School.
Ownership History
Date
Name
Owned For
Owner Type
Purchase Details
Closed on
Jun 30, 2021
Sold by
Wooten Dwight and Wooten Andrea
Bought by
Namasivayam Hari and Muthusamy Aruna
Current Estimated Value
Home Financials for this Owner
Home Financials are based on the most recent Mortgage that was taken out on this home.
Original Mortgage
$520,000
Outstanding Balance
$471,819
Interest Rate
2.9%
Mortgage Type
Commercial
Estimated Equity
$230,831
Purchase Details
Closed on
Mar 24, 2021
Sold by
Wright Carroll Lynn and Wright Maggie Elizabeth
Bought by
Wright John Allen
Purchase Details
Closed on
Jan 19, 2005
Sold by
Knight Gary and Heilman Suzanne L
Bought by
Wooten Dwight
Home Financials for this Owner
Home Financials are based on the most recent Mortgage that was taken out on this home.
Original Mortgage
$154,860
Interest Rate
5.71%
Mortgage Type
New Conventional
Create a Home Valuation Report for This Property
The Home Valuation Report is an in-depth analysis detailing your home's value as well as a comparison with similar homes in the area
Home Values in the Area
Average Home Value in this Area
Purchase History
| Date | Buyer | Sale Price | Title Company |
|---|---|---|---|
| Namasivayam Hari | -- | Truly Title | |
| Wright John Allen | -- | None Available | |
| Wooten Dwight | -- | Stnt |
Source: Public Records
Mortgage History
| Date | Status | Borrower | Loan Amount |
|---|---|---|---|
| Open | Namasivayam Hari | $520,000 | |
| Previous Owner | Wooten Dwight | $154,860 |
Source: Public Records
Tax History Compared to Growth
Tax History
| Year | Tax Paid | Tax Assessment Tax Assessment Total Assessment is a certain percentage of the fair market value that is determined by local assessors to be the total taxable value of land and additions on the property. | Land | Improvement |
|---|---|---|---|---|
| 2025 | $12,500 | $560,597 | $303,496 | $257,101 |
| 2024 | $12,500 | $560,597 | $303,496 | $257,101 |
| 2023 | $12,475 | $560,597 | $303,496 | $257,101 |
| 2022 | $14,030 | $560,597 | $303,496 | $257,101 |
| 2021 | $5,270 | $202,002 | $53,112 | $148,890 |
| 2020 | $5,597 | $202,002 | $53,112 | $148,890 |
| 2019 | $5,969 | $202,002 | $53,112 | $148,890 |
| 2018 | $5,971 | $202,002 | $53,112 | $148,890 |
| 2017 | $5,946 | $202,002 | $53,112 | $148,890 |
| 2016 | $5,946 | $202,002 | $53,112 | $148,890 |
| 2015 | $4,893 | $202,002 | $53,112 | $148,890 |
| 2014 | $4,893 | $196,861 | $53,112 | $143,749 |
Source: Public Records
Map
Nearby Homes
- 709 Stonelake Dr
- 800 Misty Ln
- 504 S Colonial Dr
- 1309 Wedgewood Dr
- 325 Wildrose Cir
- 380 Wildrose Cir
- 1724 W Henderson St
- 310 Shoshone Dr
- 1901 Seminole Dr
- 524 Crestridge Dr N
- 301 Comanche Dr
- 111 Goodnight Ct
- 107 Goodnight Ct
- 109 Goodnight Ct
- 525 Arroyo Dr
- 529 Arroyo Dr
- 529 Marsh St
- 1904 Cheyenne Dr
- 420 Comanche Dr
- 1902 Cheyenne Dr
- 1648 W Henderson St Unit A
- 1644 W Henderson St
- 120 Westmeadow Dr
- 1635 Robin Place
- 1656 W Henderson St
- 111 Westmeadow Dr
- 1639 Robin Place
- 1641 Robin Place
- 104 Westmeadow Dr
- 106 Westmeadow Dr
- 110 Westmeadow Dr
- 1634 Robin Place
- 300 N Hyde Park Blvd
- 1640 Robin Place
- 1638 Robin Place
- 1644 Robin Place
- 1908 Lake Tahoe Ln
- 202 Westmeadow Dr
- 201 Westmeadow Dr
- 302 N Hyde Park Blvd