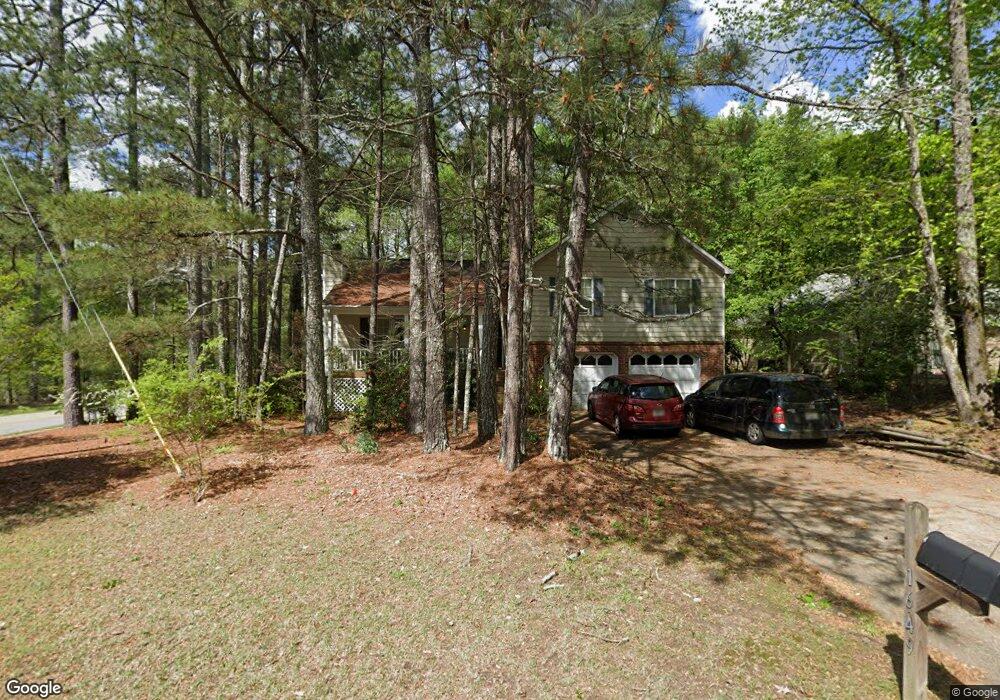
1649 Ashmar Ln SW Marietta, GA 30064
West Cobb NeighborhoodEstimated Value: $344,937 - $384,000
4
Beds
3
Baths
1,596
Sq Ft
$230/Sq Ft
Est. Value
About This Home
This home is located at 1649 Ashmar Ln SW, Marietta, GA 30064 and is currently estimated at $367,234, approximately $230 per square foot. 1649 Ashmar Ln SW is a home located in Cobb County with nearby schools including Dowell Elementary School, Lovinggood Middle School, and Hillgrove High School.
Ownership History
Date
Name
Owned For
Owner Type
Purchase Details
Closed on
Oct 5, 2010
Sold by
Smalls Lillian
Bought by
Hsbc Bk Usa
Current Estimated Value
Purchase Details
Closed on
Jun 2, 2010
Sold by
Smalls Dwight W
Bought by
Smalls Lillian I
Purchase Details
Closed on
Jul 22, 2004
Sold by
Pitts Richard D and Pitts Rebecca S
Bought by
Gill Kevin W and Gill Starla
Home Financials for this Owner
Home Financials are based on the most recent Mortgage that was taken out on this home.
Original Mortgage
$158,746
Interest Rate
6.22%
Mortgage Type
VA
Purchase Details
Closed on
Aug 12, 1994
Sold by
Spradlin Tammy L Gerald W
Bought by
Pitts Richard D Rebecca
Home Financials for this Owner
Home Financials are based on the most recent Mortgage that was taken out on this home.
Original Mortgage
$89,500
Interest Rate
4.87%
Create a Home Valuation Report for This Property
The Home Valuation Report is an in-depth analysis detailing your home's value as well as a comparison with similar homes in the area
Home Values in the Area
Average Home Value in this Area
Purchase History
| Date | Buyer | Sale Price | Title Company |
|---|---|---|---|
| Hsbc Bk Usa | -- | -- | |
| Smalls Lillian I | -- | -- | |
| Gill Kevin W | $160,000 | -- | |
| Pitts Richard D Rebecca | $99,500 | -- |
Source: Public Records
Mortgage History
| Date | Status | Borrower | Loan Amount |
|---|---|---|---|
| Previous Owner | Gill Kevin W | $158,746 | |
| Previous Owner | Pitts Richard D Rebecca | $89,500 |
Source: Public Records
Tax History Compared to Growth
Tax History
| Year | Tax Paid | Tax Assessment Tax Assessment Total Assessment is a certain percentage of the fair market value that is determined by local assessors to be the total taxable value of land and additions on the property. | Land | Improvement |
|---|---|---|---|---|
| 2024 | $3,034 | $129,496 | $26,000 | $103,496 |
| 2023 | $1,834 | $99,188 | $16,000 | $83,188 |
| 2022 | $2,395 | $99,188 | $16,000 | $83,188 |
| 2021 | $2,395 | $99,188 | $16,000 | $83,188 |
| 2020 | $2,154 | $88,180 | $16,000 | $72,180 |
| 2019 | $1,790 | $71,548 | $14,400 | $57,148 |
| 2018 | $1,790 | $71,548 | $14,400 | $57,148 |
| 2017 | $1,714 | $71,548 | $14,400 | $57,148 |
| 2016 | $1,319 | $54,776 | $14,400 | $40,376 |
| 2015 | $1,444 | $57,844 | $14,820 | $43,024 |
| 2014 | $1,456 | $57,844 | $0 | $0 |
Source: Public Records
Map
Nearby Homes
- 3006 Coffman Ct SW
- 1518 Sage Ridge Dr
- 1234 Wynford Colony SW
- 3001 Ashland Ct SW
- 1765 Dew Place
- 1567 Vine Leaf Dr
- 3354 Hannah Ct
- 2866 Wynford Dr SW Unit 2
- 3416 N Cook Rd
- 2673 Altony Dr SW
- 1884 Dovonshire Rd SW
- 1853 Edington Rd SW
- 1237 Wynford Woods SW
- 3119 Plainsman Dr
- 1311 Bustling Ln SW
- 1209 Wilkes Way SW Unit 1
- 1204 Commonwealth Ave SW
- 1524 Jade Cove Dr
- 1647 Ashmar Ln SW
- 1650 Kimble Dr SW
- 1645 Ashmar Ln SW
- 1800 Friendship Church Rd SW
- 1648 Kimble Dr SW
- 1648 Ashmar Ln SW
- 1643 Ashmar Ln SW
- 1646 Kimble Dr SW
- 1644 Ashmar Ln SW
- 1641 Ashmar Ln SW
- 1649 Kimble Dr SW
- 1644 Kimble Dr SW
- 1647 Kimble Dr SW
- 0 Friendship Cove SW Unit 8361685
- 0 Friendship Cove SW
- 1640 Ashmar Ln SW
- 1645 Kimble Dr SW
- 1639 Ashmar Ln SW
- 1642 Kimble Dr SW
- 1586 Sage Ridge Dr