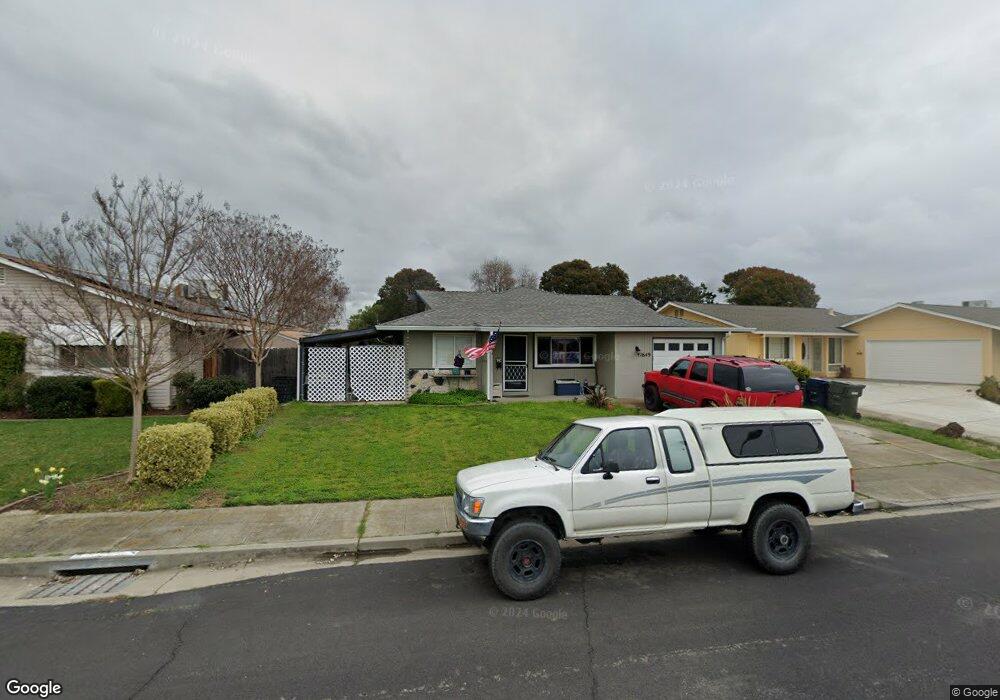
1649 Hollyhock St Livermore, CA 94551
Springtown NeighborhoodEstimated Value: $802,000 - $1,011,000
2
Beds
1
Bath
866
Sq Ft
$1,035/Sq Ft
Est. Value
About This Home
This home is located at 1649 Hollyhock St, Livermore, CA 94551 and is currently estimated at $895,946, approximately $1,034 per square foot. 1649 Hollyhock St is a home located in Alameda County with nearby schools including Altamont Creek Elementary School, Andrew N. Christensen Middle School, and Livermore High School.
Ownership History
Date
Name
Owned For
Owner Type
Purchase Details
Closed on
May 17, 2018
Sold by
Rapp Brian Clyde and Rapp Christina Marie
Bought by
Rapp Brian C and Rapp Christina M
Current Estimated Value
Purchase Details
Closed on
Jun 5, 2006
Sold by
Rapp Brian and Rapp Christina
Bought by
Rapp Brian Clyde and Rapp Christina Marie
Home Financials for this Owner
Home Financials are based on the most recent Mortgage that was taken out on this home.
Original Mortgage
$256,000
Outstanding Balance
$150,423
Interest Rate
6.56%
Mortgage Type
Fannie Mae Freddie Mac
Estimated Equity
$745,523
Purchase Details
Closed on
Jan 24, 2002
Sold by
Rapp Brian
Bought by
Rapp Brian and Rapp Christina
Home Financials for this Owner
Home Financials are based on the most recent Mortgage that was taken out on this home.
Original Mortgage
$140,000
Interest Rate
7.17%
Purchase Details
Closed on
Jun 19, 1997
Sold by
Anders John W and Anders Masami
Bought by
Rapp Brian
Home Financials for this Owner
Home Financials are based on the most recent Mortgage that was taken out on this home.
Original Mortgage
$118,400
Interest Rate
7.94%
Create a Home Valuation Report for This Property
The Home Valuation Report is an in-depth analysis detailing your home's value as well as a comparison with similar homes in the area
Home Values in the Area
Average Home Value in this Area
Purchase History
| Date | Buyer | Sale Price | Title Company |
|---|---|---|---|
| Rapp Brian C | -- | None Available | |
| Rapp Brian Clyde | -- | Chicago Title Co | |
| Rapp Brian | -- | Placer Title Company | |
| Rapp Brian | $148,000 | Old Republic Title Company |
Source: Public Records
Mortgage History
| Date | Status | Borrower | Loan Amount |
|---|---|---|---|
| Open | Rapp Brian Clyde | $256,000 | |
| Closed | Rapp Brian | $140,000 | |
| Closed | Rapp Brian | $118,400 |
Source: Public Records
Tax History Compared to Growth
Tax History
| Year | Tax Paid | Tax Assessment Tax Assessment Total Assessment is a certain percentage of the fair market value that is determined by local assessors to be the total taxable value of land and additions on the property. | Land | Improvement |
|---|---|---|---|---|
| 2025 | $5,012 | $347,447 | $72,309 | $282,138 |
| 2024 | $5,012 | $340,497 | $70,891 | $276,606 |
| 2023 | $4,923 | $340,685 | $69,501 | $271,184 |
| 2022 | $4,838 | $327,006 | $68,139 | $265,867 |
| 2021 | $4,730 | $320,458 | $66,803 | $260,655 |
| 2020 | $4,581 | $324,101 | $66,118 | $257,983 |
| 2019 | $4,588 | $317,749 | $64,822 | $252,927 |
| 2018 | $4,477 | $311,520 | $63,551 | $247,969 |
| 2017 | $4,352 | $305,414 | $62,306 | $243,108 |
| 2016 | $4,176 | $299,426 | $61,084 | $238,342 |
| 2015 | $3,925 | $294,930 | $60,167 | $234,763 |
| 2014 | $3,853 | $289,153 | $58,988 | $230,165 |
Source: Public Records
Map
Nearby Homes
- 1688 Bluebell Dr
- 1806 Bluebell Dr
- 5179 Crocus Way
- 1981 Monterey Dr
- 2013 Galloway Common
- 2035 Monterey Dr
- 1241 Hibiscus Way
- 1370 Daisy Ln
- 1333 Daisy Ln
- 4831 Zinnia Ct
- 2135 Bluebell Dr
- 1304 Heather Ln
- 1479 Spring Valley Common
- 1464 Columbine Way
- 1031 Spring Valley Common
- 814 Sundial Cir Unit 105
- 734 Bellflower St
- 5182 Sunburst Ln
- 5473 Rainflower Dr
- 5801 Flora Common
- 1661 Hollyhock St
- 1637 Hollyhock St
- 5222 Peony Dr
- 5210 Peony Dr
- 1673 Hollyhock St
- 5236 Peony Dr
- 5196 Peony Dr
- 1666 Hollyhock St
- 1642 Hollyhock St
- 1630 Hollyhock St
- 1685 Hollyhock St
- 5254 Peony Dr
- 1613 Hollyhock St
- 1678 Hollyhock St
- 5184 Peony Dr
- 1618 Hollyhock St
- 1680 Hollyhock St
- 1581 Hollyhock St
- 5270 Peony Dr
- 5211 Peony Dr