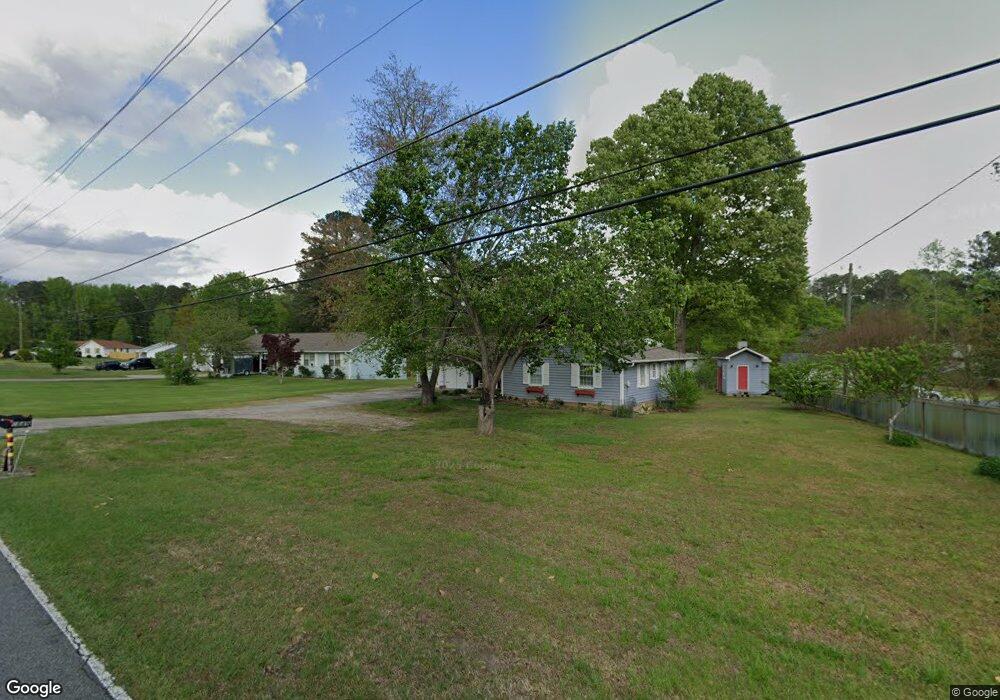
1649 W Sandtown Rd SW Marietta, GA 30064
West Cobb NeighborhoodEstimated Value: $304,000 - $377,000
3
Beds
2
Baths
1,437
Sq Ft
$230/Sq Ft
Est. Value
About This Home
This home is located at 1649 W Sandtown Rd SW, Marietta, GA 30064 and is currently estimated at $331,041, approximately $230 per square foot. 1649 W Sandtown Rd SW is a home located in Cobb County with nearby schools including Dowell Elementary School, Lovinggood Middle School, and Hillgrove High School.
Ownership History
Date
Name
Owned For
Owner Type
Purchase Details
Closed on
Apr 28, 2010
Sold by
Bank Of Ny Mellon
Bought by
Simpson Brent G and Franklin Barbara
Current Estimated Value
Home Financials for this Owner
Home Financials are based on the most recent Mortgage that was taken out on this home.
Original Mortgage
$53,200
Interest Rate
5.06%
Mortgage Type
New Conventional
Purchase Details
Closed on
Nov 3, 2009
Sold by
Hall Paula
Bought by
Bank Of Ny Mellon
Purchase Details
Closed on
May 12, 2006
Sold by
Pace William A and Pace Ann
Bought by
Hall Paula
Home Financials for this Owner
Home Financials are based on the most recent Mortgage that was taken out on this home.
Original Mortgage
$30,600
Interest Rate
6.41%
Mortgage Type
Stand Alone Refi Refinance Of Original Loan
Purchase Details
Closed on
Dec 15, 2000
Sold by
John C Adkinson Trust
Bought by
Pace William A and Pace Ann
Purchase Details
Closed on
May 16, 2000
Sold by
Smith Billy D
Bought by
Adkinson John
Create a Home Valuation Report for This Property
The Home Valuation Report is an in-depth analysis detailing your home's value as well as a comparison with similar homes in the area
Home Values in the Area
Average Home Value in this Area
Purchase History
| Date | Buyer | Sale Price | Title Company |
|---|---|---|---|
| Simpson Brent G | $66,600 | -- | |
| Bank Of Ny Mellon | $74,880 | -- | |
| Hall Paula | $153,000 | -- | |
| Pace William A | $119,000 | -- | |
| Adkinson John | $119,000 | -- |
Source: Public Records
Mortgage History
| Date | Status | Borrower | Loan Amount |
|---|---|---|---|
| Closed | Simpson Brent G | $53,200 | |
| Previous Owner | Hall Paula | $30,600 |
Source: Public Records
Tax History Compared to Growth
Tax History
| Year | Tax Paid | Tax Assessment Tax Assessment Total Assessment is a certain percentage of the fair market value that is determined by local assessors to be the total taxable value of land and additions on the property. | Land | Improvement |
|---|---|---|---|---|
| 2024 | $3,323 | $110,204 | $34,000 | $76,204 |
| 2023 | $3,450 | $114,444 | $10,000 | $104,444 |
| 2022 | $3,184 | $104,920 | $10,000 | $94,920 |
| 2021 | $2,328 | $76,700 | $10,000 | $66,700 |
| 2020 | $2,328 | $76,700 | $10,000 | $66,700 |
| 2019 | $2,089 | $68,840 | $10,000 | $58,840 |
| 2018 | $1,895 | $62,452 | $10,000 | $52,452 |
| 2017 | $1,796 | $62,452 | $10,000 | $52,452 |
| 2016 | $1,128 | $39,248 | $10,000 | $29,248 |
| 2015 | $768 | $26,056 | $16,720 | $9,336 |
| 2014 | $774 | $26,056 | $0 | $0 |
Source: Public Records
Map
Nearby Homes
- 1518 Sage Ridge Dr
- 1234 Wynford Colony SW
- 2673 Altony Dr SW
- 3001 Ashland Ct SW
- 1884 Dovonshire Rd SW
- 3006 Coffman Ct SW
- 1853 Edington Rd SW
- 2866 Wynford Dr SW Unit 2
- 1313 Bustling Ln SW
- 1311 Bustling Ln SW
- 1765 Dew Place
- 3354 Hannah Ct
- 1567 Vine Leaf Dr
- 1209 Wilkes Way SW Unit 1
- 2418 Southern Oak Dr SW
- 1237 Wynford Woods SW
- 3416 N Cook Rd
- 3119 Plainsman Dr
- 2375 Westport Cir SW Unit 2
- 1637 W Sandtown Rd SW
- 1655 W Sandtown Rd SW
- 1625 W Sandtown Rd SW
- 1640 W Sandtown Rd SW
- 1650 Dove Ct SW Unit 2
- 1640 W Sandtown and Friendship Church Rd
- W Sandtown and Friendship Church Rd
- 1610 W Sandtown Rd SW
- 1613 W Sandtown Rd SW
- 1642 Dove Ct SW Unit 2
- 1671 W Sandtown Rd SW
- 1651 Dove Ct SW Unit 2
- 1670 W Sandtown Rd SW
- 1630 Dove Ct SW
- 1506 Sage Ridge Dr
- 1502 Sage Ridge Dr
- 1649 Dove Ct SW
- 1879 Friendship Church Rd SW
- 1599 W Sandtown Rd SW
- 1590 W Sandtown Rd SW