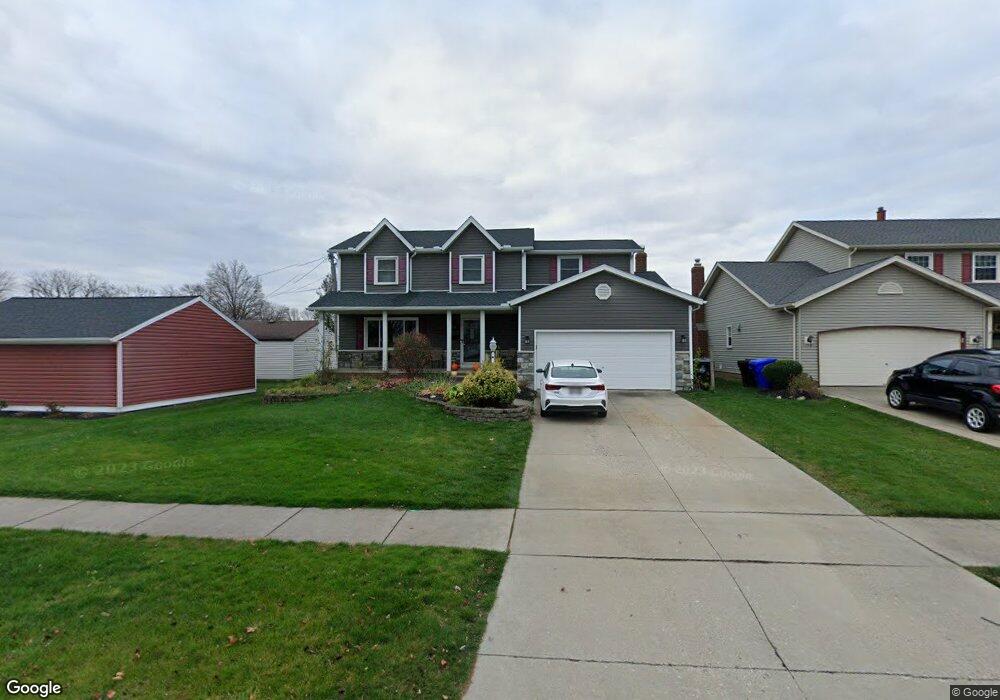
16491 Sylvia Dr Brookpark, OH 44142
Estimated Value: $347,000 - $407,000
4
Beds
3
Baths
2,208
Sq Ft
$169/Sq Ft
Est. Value
About This Home
This home is located at 16491 Sylvia Dr, Brookpark, OH 44142 and is currently estimated at $373,162, approximately $169 per square foot. 16491 Sylvia Dr is a home located in Cuyahoga County with nearby schools including Berea-Midpark Middle School, Berea-Midpark High School, and Huber Heights Preparatory Academy Parma Academy.
Ownership History
Date
Name
Owned For
Owner Type
Purchase Details
Closed on
Nov 19, 2012
Sold by
Agnew Elissa A and Agnew Richard T
Bought by
Agnew Elissa A and Agnew Richard T
Current Estimated Value
Home Financials for this Owner
Home Financials are based on the most recent Mortgage that was taken out on this home.
Original Mortgage
$178,418
Outstanding Balance
$124,624
Interest Rate
3.62%
Mortgage Type
FHA
Estimated Equity
$248,538
Purchase Details
Closed on
Feb 18, 2010
Sold by
Kilpatrick Thomas M and Kilpatrick Lynn W
Bought by
Agnew Elissa A
Home Financials for this Owner
Home Financials are based on the most recent Mortgage that was taken out on this home.
Original Mortgage
$181,649
Interest Rate
5.5%
Mortgage Type
FHA
Purchase Details
Closed on
Feb 18, 1994
Bought by
Kilpatrick Thomas M
Purchase Details
Closed on
Dec 28, 1992
Sold by
Carl Milstein and Siegal A
Bought by
Hyman Builders Inc
Purchase Details
Closed on
Jan 1, 1975
Bought by
Carl Milstein and Carl Siegal A
Create a Home Valuation Report for This Property
The Home Valuation Report is an in-depth analysis detailing your home's value as well as a comparison with similar homes in the area
Home Values in the Area
Average Home Value in this Area
Purchase History
| Date | Buyer | Sale Price | Title Company |
|---|---|---|---|
| Agnew Elissa A | -- | First American Title Ins Co | |
| Agnew Elissa A | $185,000 | Title Access Llc | |
| Kilpatrick Thomas M | $153,000 | -- | |
| Hyman Builders Inc | -- | -- | |
| Carl Milstein | -- | -- |
Source: Public Records
Mortgage History
| Date | Status | Borrower | Loan Amount |
|---|---|---|---|
| Open | Agnew Elissa A | $178,418 | |
| Closed | Agnew Elissa A | $181,649 |
Source: Public Records
Tax History Compared to Growth
Tax History
| Year | Tax Paid | Tax Assessment Tax Assessment Total Assessment is a certain percentage of the fair market value that is determined by local assessors to be the total taxable value of land and additions on the property. | Land | Improvement |
|---|---|---|---|---|
| 2024 | $5,632 | $111,650 | $20,475 | $91,175 |
| 2023 | $5,072 | $83,270 | $16,520 | $66,750 |
| 2022 | $5,036 | $83,270 | $16,520 | $66,750 |
| 2021 | $5,007 | $83,270 | $16,520 | $66,750 |
| 2020 | $5,124 | $75,010 | $14,880 | $60,130 |
| 2019 | $4,971 | $214,300 | $42,500 | $171,800 |
| 2018 | $4,558 | $75,010 | $14,880 | $60,130 |
| 2017 | $4,512 | $63,150 | $9,000 | $54,150 |
| 2016 | $4,475 | $63,150 | $9,000 | $54,150 |
| 2015 | $4,421 | $63,150 | $9,000 | $54,150 |
| 2014 | $4,421 | $66,470 | $9,450 | $57,020 |
Source: Public Records
Map
Nearby Homes
- 16051 Holland Rd
- 6054 Langer Dr
- 15924 Richard Dr
- 17810 Engle Ct
- 5966 Engle Rd
- 6363 Lockhaven Dr
- 6378 Edgehurst Dr
- 6470 Sandfield Dr
- 6195 Hardin Dr
- 6537 Liberty Bell Dr Unit 160
- 16193 Emerald Point Unit 16193
- 6577 Liberty Bell Dr Unit 20C
- 14890 Holland Rd
- 15446 Sheldon Rd
- 6401 Scott Dr
- 6728 Benedict Dr
- 6740 Benedict Dr
- 6755 Benedict Dr
- 6748 Benedict Dr
- 6720 Benedict Dr