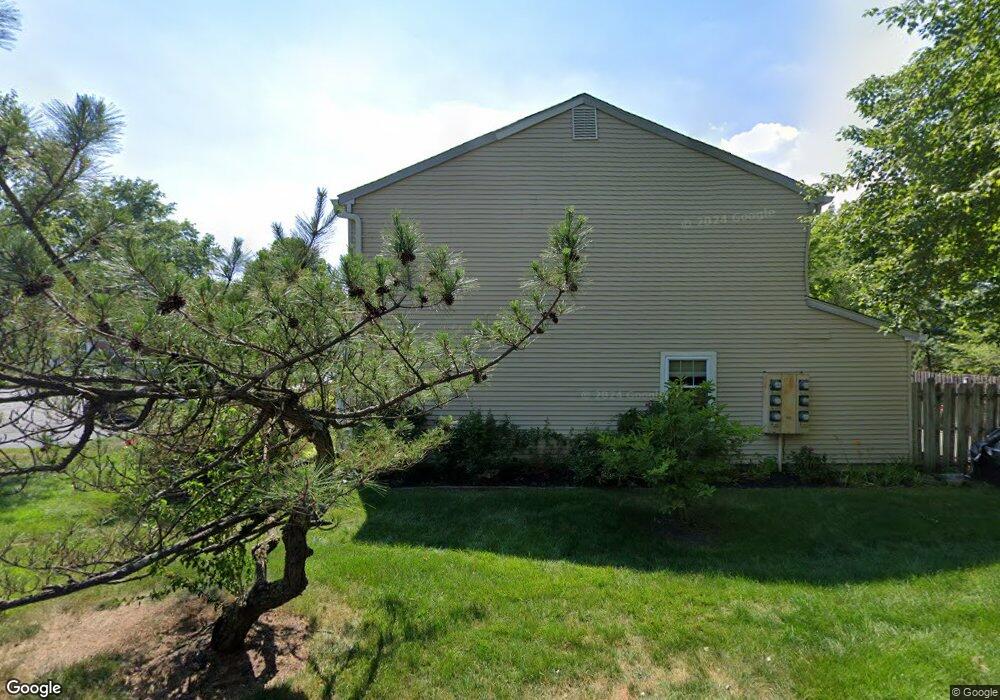
165 Devon Ct Old Bridge, NJ 08857
Estimated Value: $462,000 - $485,000
2
Beds
3
Baths
1,452
Sq Ft
$325/Sq Ft
Est. Value
About This Home
This home is located at 165 Devon Ct, Old Bridge, NJ 08857 and is currently estimated at $472,446, approximately $325 per square foot. 165 Devon Ct is a home located in Middlesex County with nearby schools including Old Bridge High School, St. Ambrose School, and Minding Miracles Learning Center.
Ownership History
Date
Name
Owned For
Owner Type
Purchase Details
Closed on
Sep 6, 2017
Sold by
Gooman Eric and Gooman Wndy
Bought by
Garcia Lourdes
Current Estimated Value
Purchase Details
Closed on
Dec 15, 1994
Sold by
Cohen Diane
Bought by
Wedelson Bernard S and Goodman Wendy
Home Financials for this Owner
Home Financials are based on the most recent Mortgage that was taken out on this home.
Original Mortgage
$109,000
Interest Rate
9.19%
Mortgage Type
FHA
Create a Home Valuation Report for This Property
The Home Valuation Report is an in-depth analysis detailing your home's value as well as a comparison with similar homes in the area
Home Values in the Area
Average Home Value in this Area
Purchase History
| Date | Buyer | Sale Price | Title Company |
|---|---|---|---|
| Garcia Lourdes | $275,000 | Old Republic National Title | |
| Wedelson Bernard S | $110,000 | -- |
Source: Public Records
Mortgage History
| Date | Status | Borrower | Loan Amount |
|---|---|---|---|
| Previous Owner | Wedelson Bernard S | $109,000 |
Source: Public Records
Tax History
| Year | Tax Paid | Tax Assessment Tax Assessment Total Assessment is a certain percentage of the fair market value that is determined by local assessors to be the total taxable value of land and additions on the property. | Land | Improvement |
|---|---|---|---|---|
| 2025 | $6,530 | $113,600 | $40,000 | $73,600 |
| 2024 | $6,273 | $113,600 | $40,000 | $73,600 |
| 2023 | $6,273 | $113,600 | $40,000 | $73,600 |
| 2022 | $6,079 | $113,600 | $40,000 | $73,600 |
| 2021 | $4,466 | $113,600 | $40,000 | $73,600 |
| 2020 | $5,906 | $113,600 | $40,000 | $73,600 |
| 2019 | $5,815 | $113,600 | $40,000 | $73,600 |
| 2018 | $5,745 | $113,600 | $40,000 | $73,600 |
| 2017 | $5,569 | $113,600 | $40,000 | $73,600 |
| 2016 | $5,455 | $113,600 | $40,000 | $73,600 |
| 2015 | $5,363 | $113,600 | $40,000 | $73,600 |
| 2014 | $5,307 | $113,600 | $40,000 | $73,600 |
Source: Public Records
Map
Nearby Homes
Your Personal Tour Guide
Ask me questions while you tour the home.