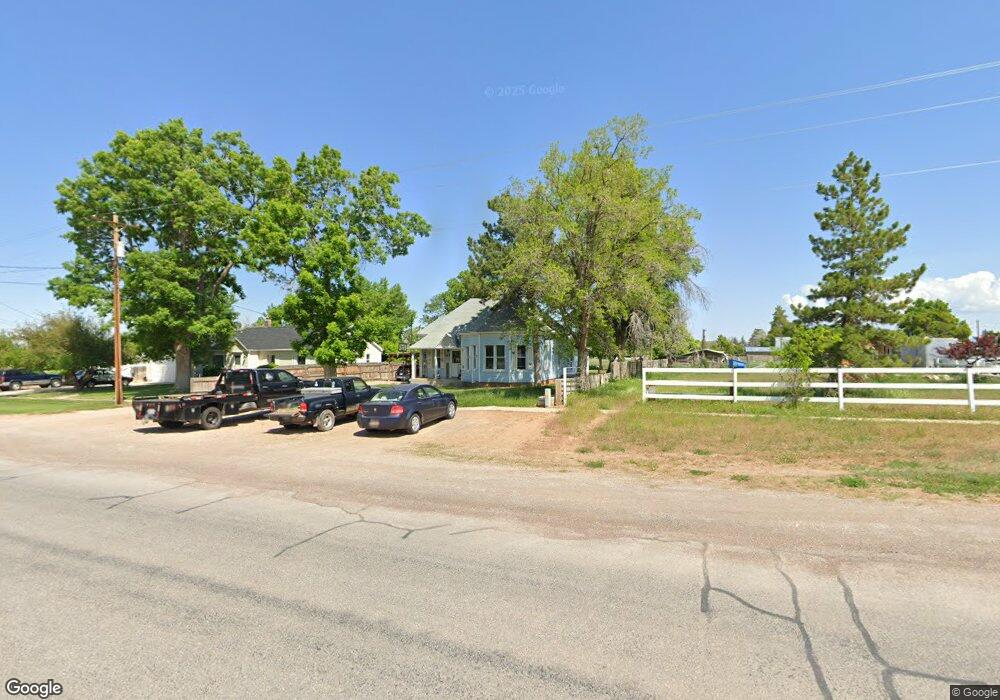
165 E Canyon Rd Fillmore, UT 84631
Estimated Value: $265,000 - $554,000
3
Beds
2
Baths
1,850
Sq Ft
$202/Sq Ft
Est. Value
About This Home
This home is located at 165 E Canyon Rd, Fillmore, UT 84631 and is currently estimated at $373,796, approximately $202 per square foot. 165 E Canyon Rd is a home located in Millard County.
Ownership History
Date
Name
Owned For
Owner Type
Purchase Details
Closed on
Dec 23, 2020
Sold by
Davies Jason J
Bought by
Davies Jason J and Davies April
Current Estimated Value
Purchase Details
Closed on
Mar 9, 2005
Sold by
Holbrook Nanette
Bought by
Davies Jason J
Create a Home Valuation Report for This Property
The Home Valuation Report is an in-depth analysis detailing your home's value as well as a comparison with similar homes in the area
Home Values in the Area
Average Home Value in this Area
Purchase History
| Date | Buyer | Sale Price | Title Company |
|---|---|---|---|
| Davies Jason J | -- | First American Title | |
| Davies Jason J | -- | Horizon Title |
Source: Public Records
Tax History
| Year | Tax Paid | Tax Assessment Tax Assessment Total Assessment is a certain percentage of the fair market value that is determined by local assessors to be the total taxable value of land and additions on the property. | Land | Improvement |
|---|---|---|---|---|
| 2025 | $1,198 | $150,407 | $22,696 | $127,711 |
| 2024 | $1,198 | $114,769 | $20,292 | $94,477 |
| 2023 | $1,269 | $114,769 | $20,292 | $94,477 |
| 2022 | $1,036 | $92,980 | $18,448 | $74,532 |
| 2021 | $901 | $77,638 | $11,979 | $65,659 |
| 2020 | $834 | $72,290 | $10,890 | $61,400 |
| 2019 | $713 | $62,020 | $10,890 | $51,130 |
| 2018 | $680 | $60,578 | $10,890 | $49,688 |
| 2017 | $581 | $49,165 | $10,890 | $38,275 |
| 2016 | $556 | $49,165 | $10,890 | $38,275 |
| 2015 | $556 | $49,165 | $10,890 | $38,275 |
| 2014 | -- | $49,165 | $10,890 | $38,275 |
| 2013 | -- | $49,165 | $10,890 | $38,275 |
Source: Public Records
Map
Nearby Homes
- 235 S 200 St E
- 40 S 100 Rd E
- 430 E Canyon Rd
- 157 E 500 South St
- 155 E 500 St S
- 405 E 500 St S
- 155 W Center St
- 465 S 100 W
- 75 N 100 West St
- 260 W 200 S
- 351 W 100 South St
- 225 W 200 St N
- 690 E 500 S
- 760 E 700 St S
- 245 W 300 N
- 390 N 100 W
- 750 800 South Fillmore
- 825 800 South Fillmore
- 800 800 South Fillmore
- 310 S 500 West Rd
Your Personal Tour Guide
Ask me questions while you tour the home.