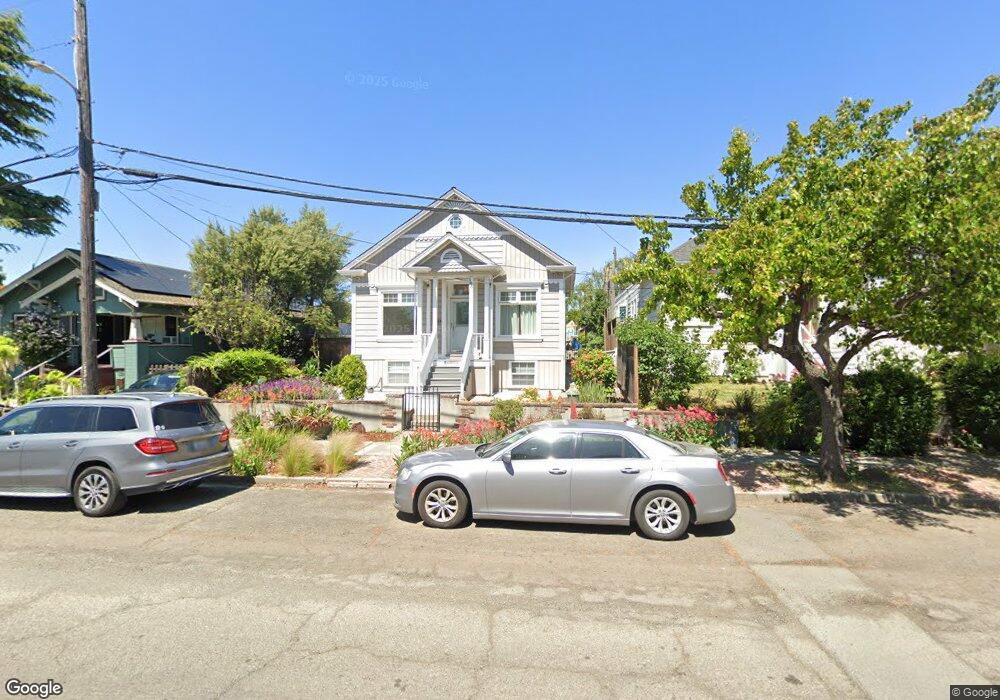
165 E F St Benicia, CA 94510
Estimated Value: $739,555 - $981,000
3
Beds
2
Baths
1,352
Sq Ft
$631/Sq Ft
Est. Value
About This Home
This home is located at 165 E F St, Benicia, CA 94510 and is currently estimated at $853,389, approximately $631 per square foot. 165 E F St is a home located in Solano County with nearby schools including Mary Farmar Elementary School, Benicia Middle School, and Benicia High School.
Ownership History
Date
Name
Owned For
Owner Type
Purchase Details
Closed on
Jun 10, 2020
Sold by
Byrne Marcus A and Byrne Mairead M
Bought by
Byrne Marcus and Byrne Mairead
Current Estimated Value
Purchase Details
Closed on
Aug 8, 2000
Sold by
Bornschein Lew
Bought by
Byrne Marcus A and Byrne Mairead M
Home Financials for this Owner
Home Financials are based on the most recent Mortgage that was taken out on this home.
Original Mortgage
$292,000
Outstanding Balance
$105,652
Interest Rate
8.19%
Estimated Equity
$747,737
Purchase Details
Closed on
Oct 29, 1999
Sold by
Mcinerney Robert James and Mcinerney Daniel Timothy
Bought by
Trumbull David E
Home Financials for this Owner
Home Financials are based on the most recent Mortgage that was taken out on this home.
Original Mortgage
$200,000
Interest Rate
7.82%
Create a Home Valuation Report for This Property
The Home Valuation Report is an in-depth analysis detailing your home's value as well as a comparison with similar homes in the area
Home Values in the Area
Average Home Value in this Area
Purchase History
| Date | Buyer | Sale Price | Title Company |
|---|---|---|---|
| Byrne Marcus | -- | None Available | |
| Byrne Marcus A | $365,000 | Placer Title Company | |
| Trumbull David E | $200,000 | Chicago Title Co |
Source: Public Records
Mortgage History
| Date | Status | Borrower | Loan Amount |
|---|---|---|---|
| Open | Byrne Marcus A | $292,000 | |
| Previous Owner | Trumbull David E | $200,000 |
Source: Public Records
Tax History
| Year | Tax Paid | Tax Assessment Tax Assessment Total Assessment is a certain percentage of the fair market value that is determined by local assessors to be the total taxable value of land and additions on the property. | Land | Improvement |
|---|---|---|---|---|
| 2025 | $6,525 | $563,645 | $150,677 | $412,968 |
| 2024 | $6,525 | $552,594 | $147,723 | $404,871 |
| 2023 | $6,366 | $541,760 | $144,827 | $396,933 |
| 2022 | $6,247 | $531,138 | $141,988 | $389,150 |
| 2021 | $6,118 | $520,724 | $139,204 | $381,520 |
| 2020 | $6,036 | $515,385 | $137,777 | $377,608 |
| 2019 | $5,929 | $505,280 | $135,076 | $370,204 |
| 2018 | $5,776 | $495,374 | $132,428 | $362,946 |
| 2017 | $5,641 | $485,662 | $129,832 | $355,830 |
| 2016 | $5,687 | $476,140 | $127,287 | $348,853 |
| 2015 | $5,542 | $468,989 | $125,376 | $343,613 |
| 2014 | $5,476 | $459,804 | $122,921 | $336,883 |
Source: Public Records
Map
Nearby Homes
Your Personal Tour Guide
Ask me questions while you tour the home.