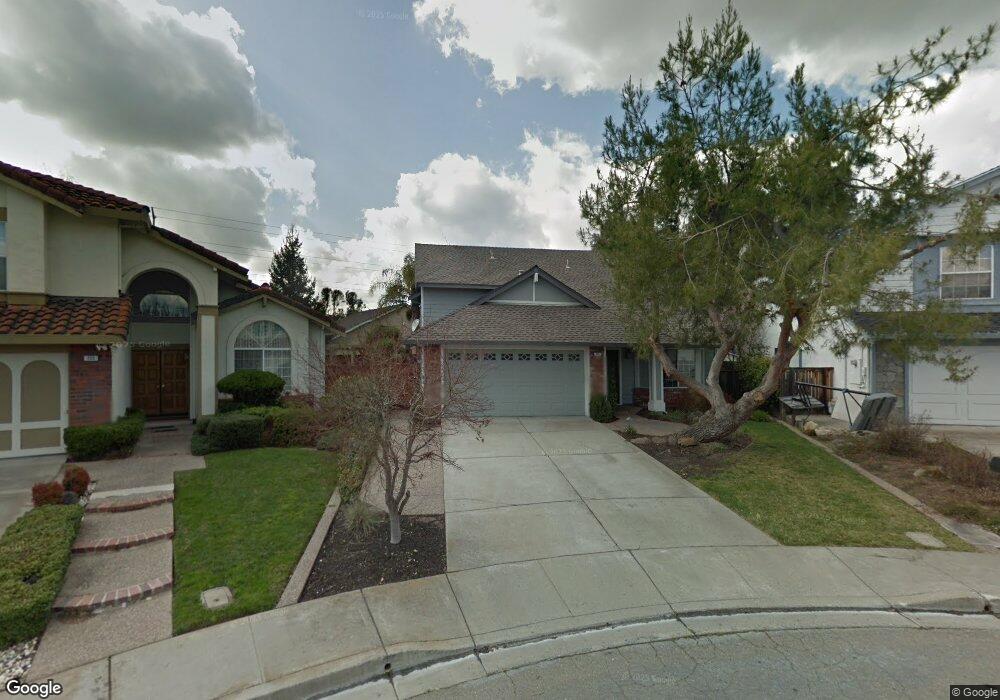
165 Fallbury Ct San Ramon, CA 94583
San Ramon Valley NeighborhoodEstimated Value: $1,569,000 - $2,051,000
5
Beds
3
Baths
3,100
Sq Ft
$573/Sq Ft
Est. Value
About This Home
This home is located at 165 Fallbury Ct, San Ramon, CA 94583 and is currently estimated at $1,775,537, approximately $572 per square foot. 165 Fallbury Ct is a home located in Contra Costa County with nearby schools including Montevideo Elementary School, Iron Horse Middle School, and California High School.
Ownership History
Date
Name
Owned For
Owner Type
Purchase Details
Closed on
Feb 14, 2003
Sold by
Davidson Roderick M and Davidson Kathy L
Bought by
Davidson Roderick M and Davidson Kathy L
Current Estimated Value
Home Financials for this Owner
Home Financials are based on the most recent Mortgage that was taken out on this home.
Original Mortgage
$125,000
Interest Rate
5.89%
Mortgage Type
Credit Line Revolving
Purchase Details
Closed on
Jan 25, 2002
Sold by
Davidson Kathy L and Davidson Rod M
Bought by
Davidson Rod M and Davidson Kathy L
Home Financials for this Owner
Home Financials are based on the most recent Mortgage that was taken out on this home.
Original Mortgage
$234,000
Interest Rate
7.17%
Mortgage Type
Purchase Money Mortgage
Purchase Details
Closed on
Jun 21, 2001
Sold by
Davidson Roderick M and Davidson Kathy L
Bought by
Davidson Roderick M and Davidson Kathy L
Create a Home Valuation Report for This Property
The Home Valuation Report is an in-depth analysis detailing your home's value as well as a comparison with similar homes in the area
Home Values in the Area
Average Home Value in this Area
Purchase History
| Date | Buyer | Sale Price | Title Company |
|---|---|---|---|
| Davidson Roderick M | -- | Multiple | |
| Davidson Roderick M | -- | Multiple | |
| Davidson Rod M | -- | Fidelity Title | |
| Davidson Roderick M | -- | -- |
Source: Public Records
Mortgage History
| Date | Status | Borrower | Loan Amount |
|---|---|---|---|
| Previous Owner | Davidson Roderick M | $125,000 | |
| Previous Owner | Davidson Rod M | $234,000 |
Source: Public Records
Tax History
| Year | Tax Paid | Tax Assessment Tax Assessment Total Assessment is a certain percentage of the fair market value that is determined by local assessors to be the total taxable value of land and additions on the property. | Land | Improvement |
|---|---|---|---|---|
| 2025 | $7,858 | $621,779 | $266,974 | $354,805 |
| 2024 | $7,554 | $609,589 | $261,740 | $347,849 |
| 2023 | $7,554 | $597,637 | $256,608 | $341,029 |
| 2022 | $7,474 | $585,920 | $251,577 | $334,343 |
| 2021 | $7,309 | $574,433 | $246,645 | $327,788 |
| 2019 | $7,201 | $557,396 | $239,330 | $318,066 |
| 2018 | $6,938 | $546,468 | $234,638 | $311,830 |
| 2017 | $6,687 | $535,754 | $230,038 | $305,716 |
| 2016 | $6,592 | $525,250 | $225,528 | $299,722 |
| 2015 | $6,495 | $517,361 | $222,141 | $295,220 |
| 2014 | $6,398 | $507,228 | $217,790 | $289,438 |
Source: Public Records
Map
Nearby Homes
- 10013 Foxboro Cir
- 10005 Foxboro Cir Unit 34
- 3237 Vera Cruz Dr
- 280 Summerford Cir
- 210 Duxbury Ct
- 311 Foxboro Ct
- 12232 Toluca Dr
- 3020 Ascot Dr
- 285 Reflections Dr Unit 23
- 115 Reflections Dr Unit 26
- 210 Reflections Dr Unit 14
- 160 Reflections Dr Unit 23
- 140 Reflections Dr Unit 21
- 9953 Mangos Dr
- 5057 Athens Dr
- 3211 De Anza Place
- 9881 Brunswick Way
- 3415 Loreto Dr
- 3409 Loreto Dr
- 2824 Sombrero Cir
- 175 Fallbury Ct
- 155 Fallbury Ct
- 562 Fallen Leaf Cir
- 145 Fallbury Ct
- 560 Fallen Leaf Cir
- 564 Fallen Leaf Cir
- 170 Fallbury Ct
- 265 Fallview St
- 275 Fallview St
- 558 Fallen Leaf Cir
- 255 Fallview St
- 566 Fallen Leaf Cir
- 135 Fallbury Ct
- 160 Fallbury Ct
- 556 Fallen Leaf Cir
- 245 Fallview St
- 568 Fallen Leaf Cir
- 150 Fallbury Ct
- 140 Fallbury Ct
- 125 Fallbury Ct
Your Personal Tour Guide
Ask me questions while you tour the home.