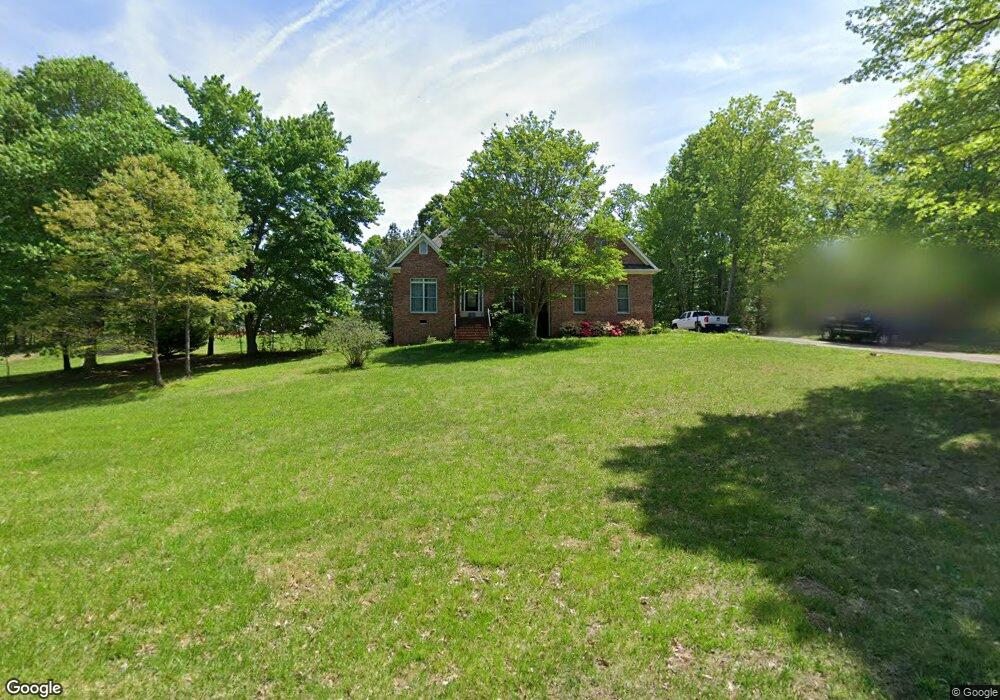
165 Hash Ln Summerfield, NC 27358
Estimated Value: $485,000 - $645,000
3
Beds
3
Baths
2,780
Sq Ft
$200/Sq Ft
Est. Value
About This Home
This home is located at 165 Hash Ln, Summerfield, NC 27358 and is currently estimated at $556,149, approximately $200 per square foot. 165 Hash Ln is a home located in Rockingham County with nearby schools including Bethany Elementary School, Rockingham County Middle School, and Rockingham County High School.
Ownership History
Date
Name
Owned For
Owner Type
Purchase Details
Closed on
May 25, 2005
Sold by
James Chales P and James Gwendolyn C
Bought by
Loggains Criag and Loggains Kay
Current Estimated Value
Home Financials for this Owner
Home Financials are based on the most recent Mortgage that was taken out on this home.
Original Mortgage
$100,000
Outstanding Balance
$52,007
Interest Rate
5.8%
Mortgage Type
New Conventional
Estimated Equity
$504,142
Purchase Details
Closed on
May 24, 2005
Sold by
James Chales P and James Gwendolyn C
Bought by
Loggains Criag and Loggains Kay
Home Financials for this Owner
Home Financials are based on the most recent Mortgage that was taken out on this home.
Original Mortgage
$100,000
Outstanding Balance
$52,007
Interest Rate
5.8%
Mortgage Type
New Conventional
Estimated Equity
$504,142
Create a Home Valuation Report for This Property
The Home Valuation Report is an in-depth analysis detailing your home's value as well as a comparison with similar homes in the area
Purchase History
| Date | Buyer | Sale Price | Title Company |
|---|---|---|---|
| Loggains Criag | $286,000 | None Available | |
| Loggains Criag | $286,000 | None Available |
Source: Public Records
Mortgage History
| Date | Status | Borrower | Loan Amount |
|---|---|---|---|
| Open | Loggains Criag | $100,000 | |
| Closed | Loggains Criag | $100,000 |
Source: Public Records
Tax History
| Year | Tax Paid | Tax Assessment Tax Assessment Total Assessment is a certain percentage of the fair market value that is determined by local assessors to be the total taxable value of land and additions on the property. | Land | Improvement |
|---|---|---|---|---|
| 2025 | $3,791 | $549,273 | $39,600 | $509,673 |
| 2024 | $3,548 | $549,273 | $39,600 | $509,673 |
| 2023 | $3,548 | $344,530 | $36,000 | $308,530 |
| 2022 | $2,720 | $344,530 | $36,000 | $308,530 |
| 2021 | $2,710 | $344,530 | $36,000 | $308,530 |
| 2020 | $2,720 | $344,530 | $36,000 | $308,530 |
| 2019 | $2,721 | $344,530 | $36,000 | $308,530 |
| 2018 | $2,609 | $329,822 | $48,000 | $281,822 |
| 2017 | $2,631 | $334,125 | $48,000 | $286,125 |
| 2015 | $2,658 | $334,125 | $48,000 | $286,125 |
| 2014 | -- | $334,125 | $48,000 | $286,125 |
Source: Public Records
Map
Nearby Homes
- 6765 Lake Brandt Rd
- 107 Cottonwood Ln
- 6640 Lake Brandt Rd
- 317 Keystone Dr
- 2527 Rivers Edge Rd
- 2525 Rivers Edge Rd
- 3522 Autumn Hills Dr
- 3530 Autumn Hills Dr
- 8451 Witty Rd
- 2519 Rivers Edge Rd
- 2518 Rivers Edge Rd
- 8194-8198 Omega Way
- 8199 Omega Way
- 8193 Omega Way
- 6309 US Highway 158
- 8191 Omega Way
- 2502 Rivers Edge Rd
- 8211 Pyramid Dr
- 13552 U S 158
- 3701 Pasture View Dr
Your Personal Tour Guide
Ask me questions while you tour the home.