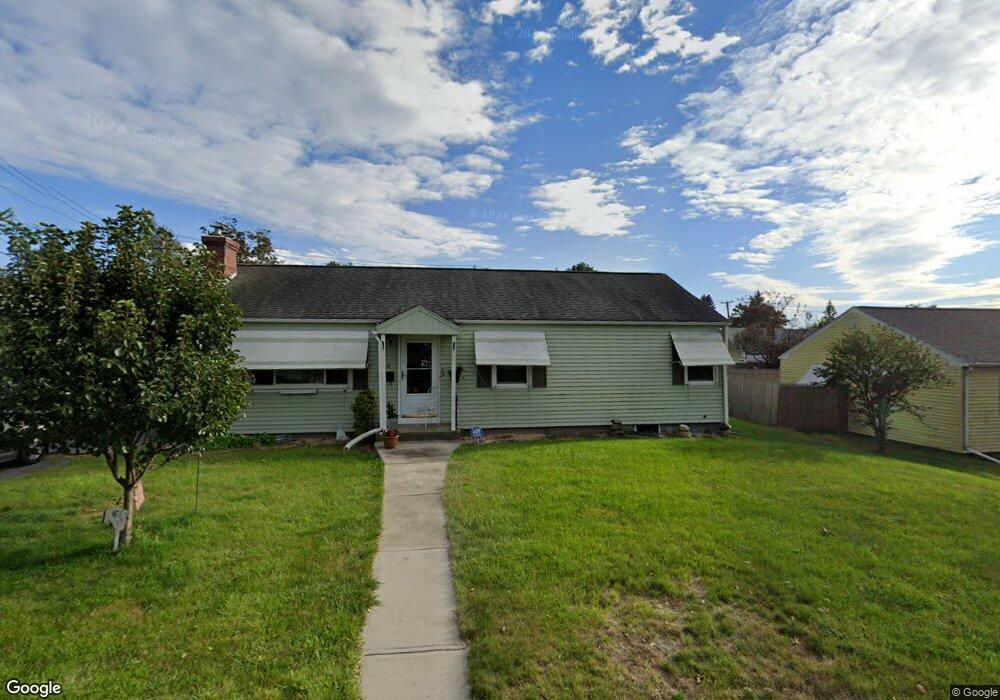
165 Hendrick St Chicopee, MA 01020
Chicopee Falls NeighborhoodEstimated Value: $286,000 - $301,000
3
Beds
2
Baths
984
Sq Ft
$298/Sq Ft
Est. Value
About This Home
This home is located at 165 Hendrick St, Chicopee, MA 01020 and is currently estimated at $293,436, approximately $298 per square foot. 165 Hendrick St is a home located in Hampden County with nearby schools including Belcher Elementary School, Bellamy Middle School, and Chicopee High School.
Ownership History
Date
Name
Owned For
Owner Type
Purchase Details
Closed on
Nov 20, 2025
Sold by
Montminy Etienne J and Fay Michelle M
Bought by
Etienne & M Montminy Ret and Montminy
Current Estimated Value
Purchase Details
Closed on
Nov 5, 2002
Sold by
Cortis Carl L and Cortis Cindy L
Bought by
Montminy Etienne J and Fay Michelle M
Home Financials for this Owner
Home Financials are based on the most recent Mortgage that was taken out on this home.
Original Mortgage
$113,223
Interest Rate
6.09%
Mortgage Type
Purchase Money Mortgage
Create a Home Valuation Report for This Property
The Home Valuation Report is an in-depth analysis detailing your home's value as well as a comparison with similar homes in the area
Home Values in the Area
Average Home Value in this Area
Purchase History
| Date | Buyer | Sale Price | Title Company |
|---|---|---|---|
| Etienne & M Montminy Ret | -- | -- | |
| Montminy Etienne J | $115,000 | -- |
Source: Public Records
Mortgage History
| Date | Status | Borrower | Loan Amount |
|---|---|---|---|
| Previous Owner | Montminy Etienne J | $113,223 |
Source: Public Records
Tax History
| Year | Tax Paid | Tax Assessment Tax Assessment Total Assessment is a certain percentage of the fair market value that is determined by local assessors to be the total taxable value of land and additions on the property. | Land | Improvement |
|---|---|---|---|---|
| 2025 | $3,413 | $225,100 | $86,100 | $139,000 |
| 2024 | $3,300 | $223,600 | $84,400 | $139,200 |
| 2023 | $3,066 | $202,400 | $76,700 | $125,700 |
| 2022 | $2,932 | $172,600 | $66,700 | $105,900 |
| 2021 | $3,219 | $161,200 | $60,700 | $100,500 |
| 2020 | $2,746 | $152,200 | $60,700 | $91,500 |
| 2019 | $2,620 | $145,900 | $60,700 | $85,200 |
| 2018 | $9 | $139,800 | $57,800 | $82,000 |
| 2017 | $2,254 | $130,200 | $57,800 | $72,400 |
| 2016 | $2,257 | $133,500 | $57,800 | $75,700 |
| 2015 | $2,499 | $142,500 | $57,800 | $84,700 |
| 2014 | $1,250 | $142,500 | $57,800 | $84,700 |
Source: Public Records
Map
Nearby Homes
- 181 Beauchamp Terrace
- 101 Huntington Ave
- 104 Madison St
- 105 Lachine St
- 95 Washington St
- 104 Chateaugay St
- 33 Washington St
- 70 Chateaugay St
- 112 W Canton Cir
- 30 Butler Ave
- 156 East St
- 55 Fuller St
- 66 Thornton St
- 45 Hastings St
- 23 Sterling St
- 238 E Main St
- 126 Windemere St
- 147 Bowles Park
- 61 Abbey Memorial Dr Unit 153
- 3 Fordham St
- 162 Beauchamp Terrace
- 150 Beauchamp Terrace
- 155 Hendrick St
- 166 Hendrick St
- 144 Beauchamp Terrace
- 179 Waite Ave Unit Lot A
- 179 Waite Ave
- 180 Beauchamp Terrace Unit 16
- 180 Beauchamp Terrace Unit 15
- 180 Beauchamp Terrace Unit 14
- 180 Beauchamp Terrace Unit 13
- 180 Beauchamp Terrace Unit 12
- 180 Beauchamp Terrace Unit 11
- 180 Beauchamp Terrace Unit 10
- 180 Beauchamp Terrace Unit 9
- 180 Beauchamp Terrace Unit 8
- 180 Beauchamp Terrace Unit 7
- 180 Beauchamp Terrace Unit 6
- 180 Beauchamp Terrace Unit 5
- 180 Beauchamp Terrace Unit 4
Your Personal Tour Guide
Ask me questions while you tour the home.