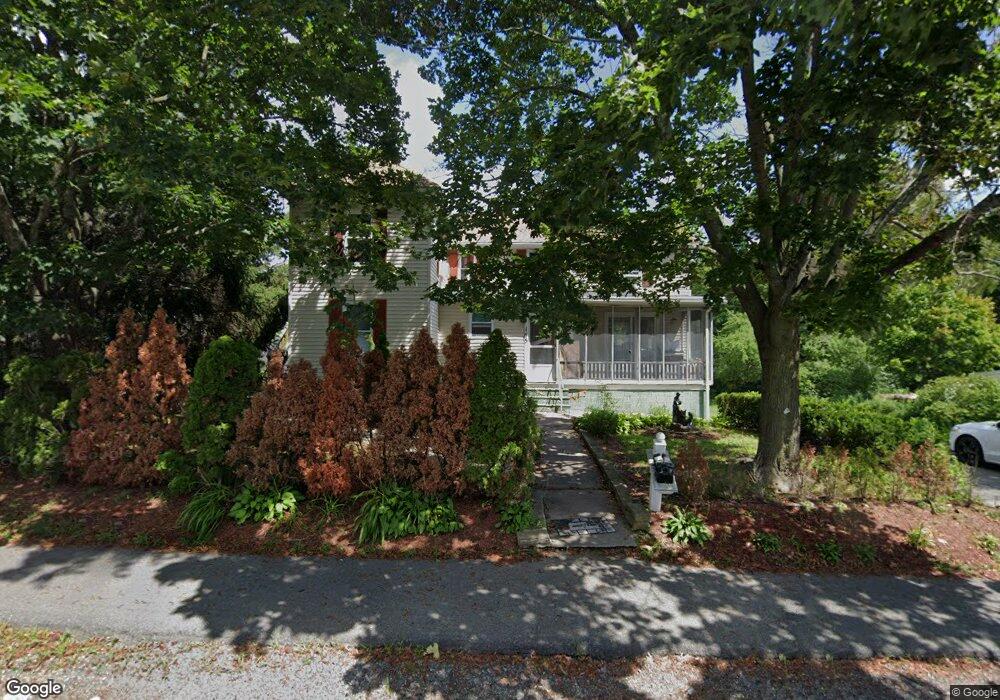
165 Manning St Hudson, MA 01749
Estimated Value: $520,000 - $639,000
4
Beds
2
Baths
1,866
Sq Ft
$301/Sq Ft
Est. Value
About This Home
This home is located at 165 Manning St, Hudson, MA 01749 and is currently estimated at $561,161, approximately $300 per square foot. 165 Manning St is a home located in Middlesex County with nearby schools including David J. Quinn Middle School, Hudson High School, and First Steps Children's Center.
Ownership History
Date
Name
Owned For
Owner Type
Purchase Details
Closed on
Mar 3, 2025
Sold by
Navarro Jose D and Pedroza Maria M
Bought by
Navarro Jose D
Current Estimated Value
Purchase Details
Closed on
Sep 29, 2006
Sold by
Nguyen Hung Q
Bought by
Navarro Jose Davalos and Pedroza Maria Martinez
Home Financials for this Owner
Home Financials are based on the most recent Mortgage that was taken out on this home.
Original Mortgage
$312,550
Interest Rate
6.52%
Mortgage Type
Purchase Money Mortgage
Purchase Details
Closed on
May 30, 2001
Sold by
Ferreira Rosa M
Bought by
Nguyen Hung Q
Home Financials for this Owner
Home Financials are based on the most recent Mortgage that was taken out on this home.
Original Mortgage
$180,000
Interest Rate
7.09%
Mortgage Type
Purchase Money Mortgage
Create a Home Valuation Report for This Property
The Home Valuation Report is an in-depth analysis detailing your home's value as well as a comparison with similar homes in the area
Home Values in the Area
Average Home Value in this Area
Purchase History
| Date | Buyer | Sale Price | Title Company |
|---|---|---|---|
| Navarro Jose D | -- | None Available | |
| Navarro Jose D | -- | None Available | |
| Navarro Jose Davalos | $329,000 | -- | |
| Navarro Jose Davalos | $329,000 | -- | |
| Nguyen Hung Q | $200,000 | -- |
Source: Public Records
Mortgage History
| Date | Status | Borrower | Loan Amount |
|---|---|---|---|
| Previous Owner | Navarro Jose Davalos | $312,550 | |
| Previous Owner | Nguyen Hung Q | $180,000 | |
| Previous Owner | Nguyen Hung Q | $340,000 |
Source: Public Records
Tax History Compared to Growth
Tax History
| Year | Tax Paid | Tax Assessment Tax Assessment Total Assessment is a certain percentage of the fair market value that is determined by local assessors to be the total taxable value of land and additions on the property. | Land | Improvement |
|---|---|---|---|---|
| 2025 | $6,018 | $433,600 | $160,200 | $273,400 |
| 2024 | $5,610 | $400,700 | $145,700 | $255,000 |
| 2023 | $5,768 | $395,100 | $140,100 | $255,000 |
| 2022 | $5,034 | $317,400 | $127,300 | $190,100 |
| 2021 | $9,300 | $286,500 | $121,200 | $165,300 |
| 2020 | $10,372 | $118,900 | $118,900 | $0 |
| 2019 | $10,077 | $289,300 | $118,900 | $170,400 |
| 2018 | $4,603 | $263,000 | $113,200 | $149,800 |
| 2017 | $4,261 | $243,500 | $107,900 | $135,600 |
| 2016 | $4,122 | $238,400 | $107,900 | $130,500 |
| 2015 | $3,587 | $207,700 | $107,900 | $99,800 |
| 2014 | $3,414 | $196,000 | $94,500 | $101,500 |
Source: Public Records
Map
Nearby Homes
- 74 Cox St Unit 9
- 200 Manning St Unit 6C
- 200 Manning St Unit 14B
- 1 Barracks Rd Unit 1
- 104 Lincoln St
- 133 Lincoln St
- 2 Edith Rd
- 55 Cottage St
- 248 Main St Unit 207
- 248 Main St Unit 216
- 26 Marychris Dr
- 65 Main St
- 18-24 River St Unit 1
- 16 Houghton St
- 76 Woobly Rd
- 12 Old County Rd
- 12 Old County Rd Unit 20
- 11 Barracks Rd Unit 11
- 9 Barracks Rd Unit 9
- 3 Barracks Rd Unit 3