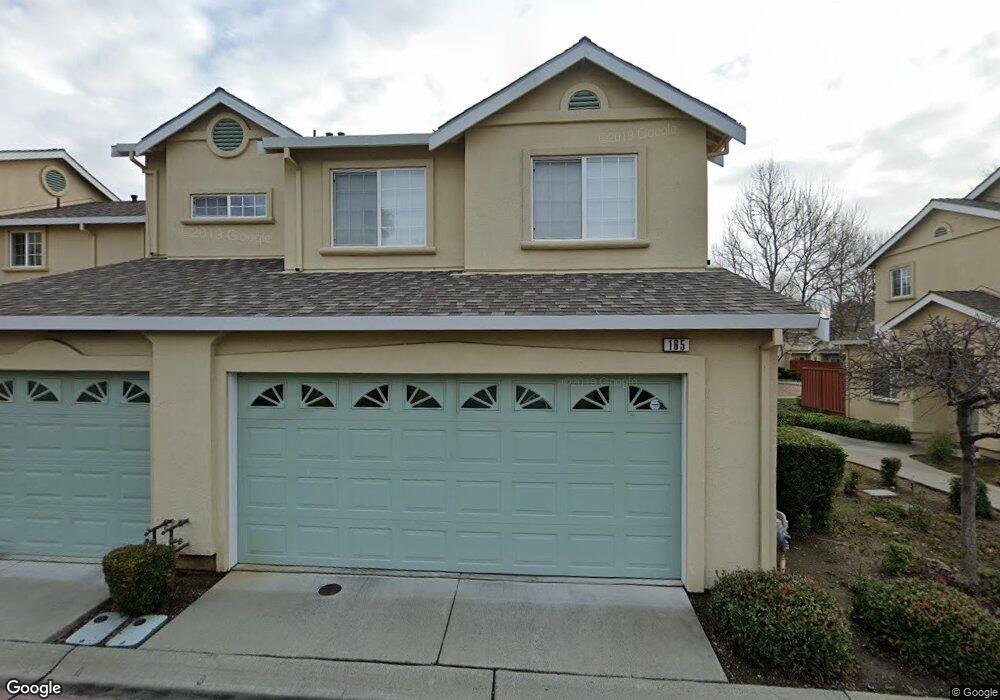
165 Richland Way Fairfield, CA 94534
Estimated Value: $414,000 - $525,000
3
Beds
3
Baths
1,306
Sq Ft
$347/Sq Ft
Est. Value
About This Home
This home is located at 165 Richland Way, Fairfield, CA 94534 and is currently estimated at $452,891, approximately $346 per square foot. 165 Richland Way is a home located in Solano County with nearby schools including K. I. Jones Elementary School, Angelo Rodriguez High School, and Solano Christian Academy.
Ownership History
Date
Name
Owned For
Owner Type
Purchase Details
Closed on
Dec 14, 2010
Sold by
The Secretary Of Veterans Affairs
Bought by
Habtemariam Melkamu and Kassa Adanech D
Current Estimated Value
Home Financials for this Owner
Home Financials are based on the most recent Mortgage that was taken out on this home.
Original Mortgage
$155,944
Outstanding Balance
$103,813
Interest Rate
4.37%
Mortgage Type
FHA
Estimated Equity
$349,078
Purchase Details
Closed on
Aug 4, 2010
Sold by
Bac Home Loans Servicing Lp
Bought by
The Secretary Of Veterans Affairs
Purchase Details
Closed on
Aug 2, 2010
Sold by
Max Kyle A and Max Jessica L
Bought by
Bac Home Loans Servicing Lp
Purchase Details
Closed on
Jul 23, 2008
Sold by
Lasalle Bank Na
Bought by
Max Kyle A and Max Jessica L
Home Financials for this Owner
Home Financials are based on the most recent Mortgage that was taken out on this home.
Original Mortgage
$214,515
Interest Rate
6.41%
Mortgage Type
VA
Purchase Details
Closed on
Apr 29, 2008
Sold by
Andres Rachel
Bought by
Lasalle Bank Na
Purchase Details
Closed on
Jun 16, 2005
Sold by
Rathbun Charles and Rathbun Jennifer
Bought by
Andres Rachel
Home Financials for this Owner
Home Financials are based on the most recent Mortgage that was taken out on this home.
Original Mortgage
$80,000
Interest Rate
5.72%
Mortgage Type
Stand Alone Second
Purchase Details
Closed on
Feb 11, 2003
Sold by
Rathbun Charles and Rathbun Jennifer
Bought by
Rathbun Charles and Rathbun Jennifer
Home Financials for this Owner
Home Financials are based on the most recent Mortgage that was taken out on this home.
Original Mortgage
$218,450
Interest Rate
5.89%
Purchase Details
Closed on
May 2, 2002
Sold by
Southbridge Llc
Bought by
Rathbun Charles and Rathbun Jennifer
Home Financials for this Owner
Home Financials are based on the most recent Mortgage that was taken out on this home.
Original Mortgage
$213,681
Interest Rate
7.18%
Purchase Details
Closed on
Mar 30, 2001
Sold by
Solano Development Inc
Bought by
Southbridge Llc
Home Financials for this Owner
Home Financials are based on the most recent Mortgage that was taken out on this home.
Original Mortgage
$5,500,000
Interest Rate
6.98%
Mortgage Type
Construction
Purchase Details
Closed on
Mar 5, 2001
Sold by
Solano County Housing Partners I
Bought by
Solano Development Inc
Home Financials for this Owner
Home Financials are based on the most recent Mortgage that was taken out on this home.
Original Mortgage
$5,500,000
Interest Rate
6.98%
Mortgage Type
Construction
Create a Home Valuation Report for This Property
The Home Valuation Report is an in-depth analysis detailing your home's value as well as a comparison with similar homes in the area
Home Values in the Area
Average Home Value in this Area
Purchase History
| Date | Buyer | Sale Price | Title Company |
|---|---|---|---|
| Habtemariam Melkamu | $160,000 | First American Title | |
| The Secretary Of Veterans Affairs | -- | Landsafe Title | |
| Bac Home Loans Servicing Lp | $145,414 | Landsafe Title | |
| Max Kyle A | $210,000 | Commerce Title Company | |
| Lasalle Bank Na | $309,225 | None Available | |
| Andres Rachel | $400,000 | Chicago Title Co | |
| Rathbun Charles | -- | Frontier Title Co | |
| Rathbun Charles | $220,500 | Frontier Title Company | |
| Southbridge Llc | -- | -- | |
| Solano Development Inc | -- | -- |
Source: Public Records
Mortgage History
| Date | Status | Borrower | Loan Amount |
|---|---|---|---|
| Open | Habtemariam Melkamu | $155,944 | |
| Previous Owner | Max Kyle A | $214,515 | |
| Previous Owner | Andres Rachel | $80,000 | |
| Previous Owner | Andres Rachel | $320,000 | |
| Previous Owner | Rathbun Charles | $218,450 | |
| Previous Owner | Rathbun Charles | $213,681 | |
| Previous Owner | Southbridge Llc | $5,500,000 |
Source: Public Records
Tax History Compared to Growth
Tax History
| Year | Tax Paid | Tax Assessment Tax Assessment Total Assessment is a certain percentage of the fair market value that is determined by local assessors to be the total taxable value of land and additions on the property. | Land | Improvement |
|---|---|---|---|---|
| 2025 | $2,229 | $204,977 | $51,240 | $153,737 |
| 2024 | $2,229 | $200,959 | $50,236 | $150,723 |
| 2023 | $2,159 | $197,019 | $49,251 | $147,768 |
| 2022 | $2,171 | $193,157 | $48,287 | $144,870 |
| 2021 | $2,148 | $189,371 | $47,341 | $142,030 |
| 2020 | $2,269 | $187,430 | $46,856 | $140,574 |
| 2019 | $2,217 | $183,756 | $45,938 | $137,818 |
| 2018 | $2,280 | $180,154 | $45,038 | $135,116 |
| 2017 | $2,301 | $176,622 | $44,155 | $132,467 |
| 2016 | $2,278 | $173,160 | $43,290 | $129,870 |
| 2015 | $2,148 | $170,560 | $42,640 | $127,920 |
| 2014 | $2,130 | $167,220 | $41,805 | $125,415 |
Source: Public Records
Map
Nearby Homes
- 2846 Owens St
- 3033 Vista Grande
- 2796 Mankas Blvd
- 1737 Kearny Ct
- 3114 Lomita Ct
- 2695 Vista Linda
- 2045 Dorland Dr
- 2051 Barbour Dr
- 3109 Burbank Dr
- 2724 Toland Dr
- 2125 Mecca Ct
- 1737 Alford Dr
- 2635 Alvarado Ct Unit 3
- 1986 Larchmont Cir
- 2530 Vista Grande
- 2503 China Ct
- 3451 Nantucket Dr
- 2517 Kingsmill Ln
- 124 Cannes Ct
- 2415 Tea Ct
- 164 Richland Way
- 163 Richland Way
- 166 Scottsburg Ct
- 162 Richland Way
- 167 Scottsburg Ct
- 154 Sutherlin Ln
- 182 Richland Way
- 183 Richland Way
- 153 Sutherlin Ln
- 184 Richland Way
- 181 Scottsburg Ct
- 168 Scottsburg Ct
- 180 Scottsburg Ct
- 152 Sutherlin Ln
- 169 Scottsburg Ct
- 179 Scottsburg Ct
- 151 Sutherlin Ln
- 185 Canby Way
- 143 Southbridge Ln
- 178 Scottsburg Ct