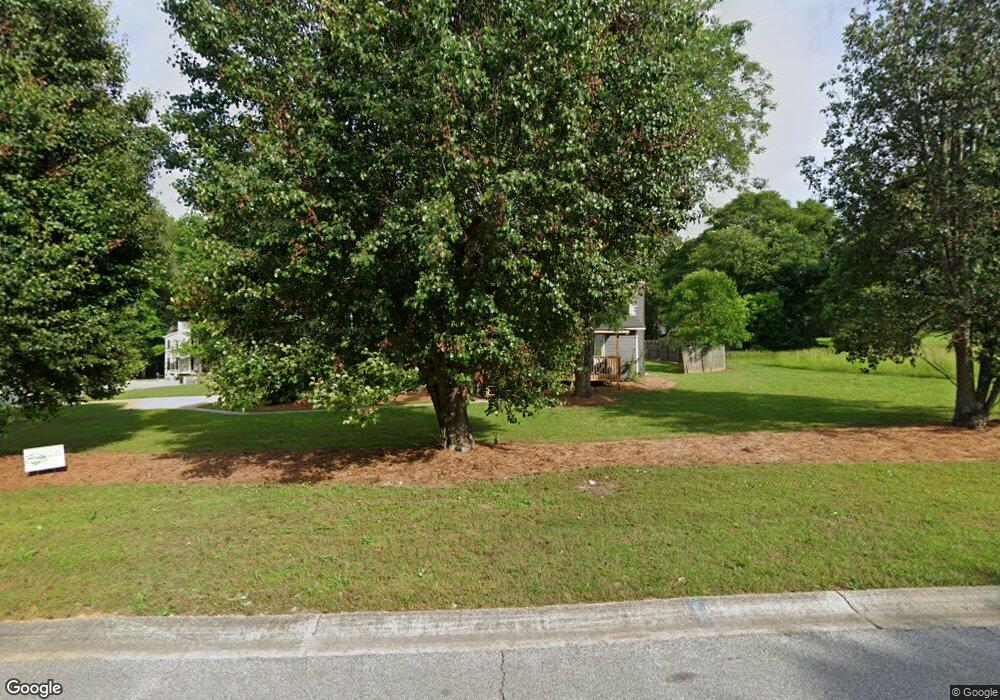
165 River Ridge Dr Carrollton, GA 30117
Estimated Value: $265,298 - $302,000
3
Beds
2
Baths
1,520
Sq Ft
$187/Sq Ft
Est. Value
About This Home
This home is located at 165 River Ridge Dr, Carrollton, GA 30117 and is currently estimated at $283,575, approximately $186 per square foot. 165 River Ridge Dr is a home located in Carroll County with nearby schools including Central Elementary School, Central Middle School, and Central High School.
Ownership History
Date
Name
Owned For
Owner Type
Purchase Details
Closed on
Aug 3, 2021
Sold by
Whitlock Stephen J
Bought by
Read Mary Kaitlin
Current Estimated Value
Home Financials for this Owner
Home Financials are based on the most recent Mortgage that was taken out on this home.
Original Mortgage
$213,750
Outstanding Balance
$194,365
Interest Rate
2.9%
Mortgage Type
New Conventional
Estimated Equity
$89,210
Purchase Details
Closed on
Jun 26, 2008
Sold by
Whitlock Stephen J
Bought by
Whitlock Stephen J and Whitlock Kelli Erin
Home Financials for this Owner
Home Financials are based on the most recent Mortgage that was taken out on this home.
Original Mortgage
$121,985
Interest Rate
6.08%
Mortgage Type
FHA
Purchase Details
Closed on
Oct 2, 2007
Sold by
Potts Michael David
Bought by
Lease Purchase Ii Inc
Purchase Details
Closed on
Jan 6, 1989
Sold by
Williams Clint Const
Bought by
Potts Michael
Create a Home Valuation Report for This Property
The Home Valuation Report is an in-depth analysis detailing your home's value as well as a comparison with similar homes in the area
Home Values in the Area
Average Home Value in this Area
Purchase History
| Date | Buyer | Sale Price | Title Company |
|---|---|---|---|
| Read Mary Kaitlin | $225,000 | -- | |
| Whitlock Stephen J | -- | -- | |
| Whitlock Stephen J | $123,900 | -- | |
| Lease Purchase Ii Inc | $75,147 | -- | |
| Potts Michael | $8,500 | -- |
Source: Public Records
Mortgage History
| Date | Status | Borrower | Loan Amount |
|---|---|---|---|
| Open | Read Mary Kaitlin | $213,750 | |
| Previous Owner | Whitlock Stephen J | $121,985 |
Source: Public Records
Tax History Compared to Growth
Tax History
| Year | Tax Paid | Tax Assessment Tax Assessment Total Assessment is a certain percentage of the fair market value that is determined by local assessors to be the total taxable value of land and additions on the property. | Land | Improvement |
|---|---|---|---|---|
| 2024 | $2,269 | $104,314 | $6,000 | $98,314 |
| 2023 | $2,269 | $95,360 | $6,000 | $89,360 |
| 2022 | $1,698 | $67,708 | $6,000 | $61,708 |
| 2021 | $1,202 | $58,890 | $6,000 | $52,890 |
| 2020 | $1,104 | $53,382 | $6,000 | $47,382 |
| 2019 | $1,050 | $50,085 | $6,000 | $44,085 |
| 2018 | $943 | $43,541 | $6,000 | $37,541 |
| 2017 | $945 | $43,541 | $6,000 | $37,541 |
| 2016 | $946 | $43,541 | $6,000 | $37,541 |
| 2015 | $784 | $32,026 | $4,000 | $28,026 |
| 2014 | $709 | $29,224 | $4,000 | $25,224 |
Source: Public Records
Map
Nearby Homes
- 40 Red Holly Gap
- 21 Crabapple Place
- The Coleman Plan at Summerfield Place
- The Pearson Plan at Summerfield Place
- The Piedmont Plan at Summerfield Place
- The Harrington Plan at Summerfield Place
- The McGinnis Plan at Summerfield Place
- The Telfair Plan at Summerfield Place
- 295 Timber Ridge Trail
- 95 Camp Ln
- 115 Greenwood Ln
- 107 Hickory Chase Unit 102
- 107 Hickory Chase
- 202 Hickory Chase
- 20 Camp Ct
- 142 Riversong Rd Unit 56
- 181 Riversong Rd Unit 55
- 181 Riversong Rd
- 142 Riversong Rd
- 127 S Ole Hickory Trail
- 164 River Ridge Dr
- 17 Sweetgum Hollow
- 10 Sweetgum Hollow
- 34 Red Holly Gap
- 25 Sweetgum Hollow
- 8 Red Holly Gap
- 188 River Ridge Dr
- 18 Sweetgum Hollow
- 32 Red Holly Gap Unit 34
- 32 Red Holly Gap
- 148 River Ridge Dr
- 191 River Ridge Dr
- 20 Thornhill Dr
- 138 River Ridge Dr
- 25 Thornhill Dr
- 29 Thornhill Dr
- 128 River Ridge Dr
- 23 Red Holly Gap
- 113 River Ridge Dr
- 113 River Ridge Dr