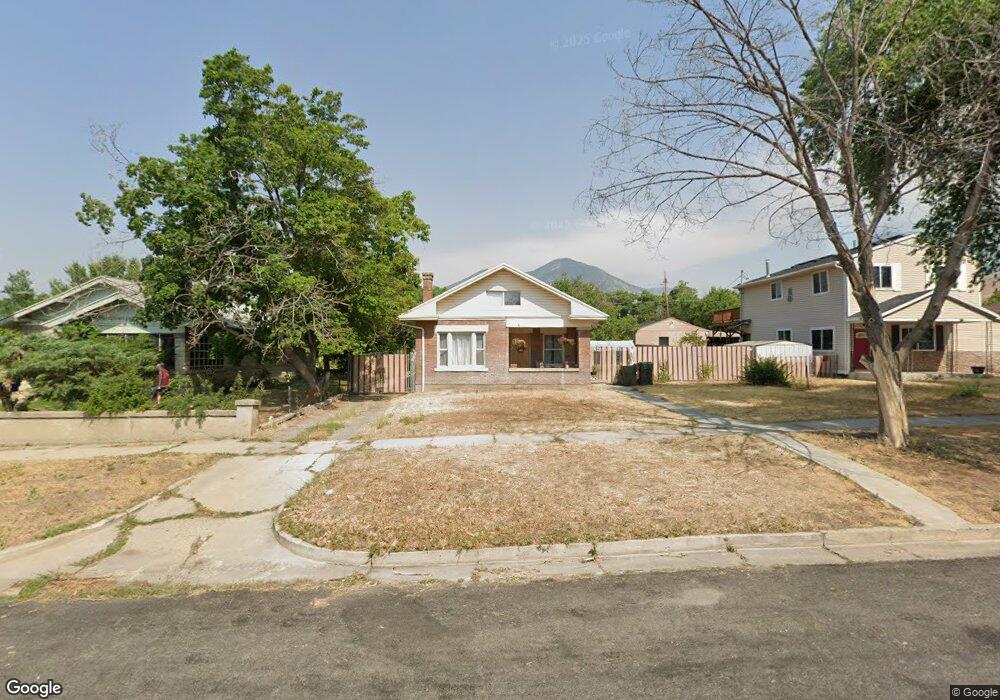
165 S 100 E Tooele, UT 84074
Estimated Value: $340,000 - $397,840
4
Beds
2
Baths
2,526
Sq Ft
$149/Sq Ft
Est. Value
About This Home
This home is located at 165 S 100 E, Tooele, UT 84074 and is currently estimated at $377,210, approximately $149 per square foot. 165 S 100 E is a home located in Tooele County with nearby schools including Sterling Elementary School, Tooele Junior High School, and Tooele High School.
Ownership History
Date
Name
Owned For
Owner Type
Purchase Details
Closed on
Oct 26, 2021
Sold by
Pioneer Reverse Exchange Lc
Bought by
Curtis John
Current Estimated Value
Purchase Details
Closed on
Sep 16, 2021
Sold by
Pixey Dustin
Bought by
Sheen Properties Llc
Purchase Details
Closed on
Sep 14, 2021
Sold by
Pixey Dustin
Bought by
Sheen Properties Llc
Purchase Details
Closed on
Sep 4, 2021
Sold by
Sheen Properties Llc
Bought by
Pioneer Reverse Exchange Lc
Purchase Details
Closed on
Jul 29, 2009
Sold by
Gonzales Eli M and Smith Debra J
Bought by
Pixey Dustin
Home Financials for this Owner
Home Financials are based on the most recent Mortgage that was taken out on this home.
Original Mortgage
$158,163
Interest Rate
5.3%
Mortgage Type
New Conventional
Purchase Details
Closed on
Dec 19, 2005
Sold by
Gonzales Margie J
Bought by
Gonzales Eli
Purchase Details
Closed on
Dec 16, 2005
Sold by
Gonzlaes Eli M
Bought by
Gonzles Eli M and Smith Debra J
Create a Home Valuation Report for This Property
The Home Valuation Report is an in-depth analysis detailing your home's value as well as a comparison with similar homes in the area
Purchase History
| Date | Buyer | Sale Price | Title Company |
|---|---|---|---|
| Curtis John | -- | Pioneer Title Ins Agcy Lc | |
| Sheen Properties Llc | -- | Meridian Title | |
| Sheen Properties Llc | -- | Meridian Title Company | |
| Pioneer Reverse Exchange Lc | -- | Meridian Title Company | |
| Pixey Dustin | -- | Metro National Title | |
| Gonzales Eli | -- | Security Title | |
| Gonzles Eli M | -- | Security Title |
Source: Public Records
Mortgage History
| Date | Status | Borrower | Loan Amount |
|---|---|---|---|
| Previous Owner | Pixey Dustin | $158,163 | |
| Closed | Pioneer Reverse Exchange Lc | $0 |
Source: Public Records
Tax History
| Year | Tax Paid | Tax Assessment Tax Assessment Total Assessment is a certain percentage of the fair market value that is determined by local assessors to be the total taxable value of land and additions on the property. | Land | Improvement |
|---|---|---|---|---|
| 2025 | $2,748 | $416,687 | $96,250 | $320,437 |
| 2024 | $2,786 | $212,666 | $52,938 | $159,728 |
| 2023 | $2,786 | $199,183 | $51,274 | $147,909 |
| 2022 | $2,501 | $215,162 | $57,750 | $157,412 |
| 2021 | $2,173 | $156,405 | $38,500 | $117,905 |
| 2020 | $2,060 | $253,072 | $42,813 | $210,259 |
| 2019 | $1,876 | $226,303 | $42,813 | $183,490 |
| 2018 | $1,798 | $205,212 | $45,000 | $160,212 |
| 2017 | $1,474 | $201,943 | $36,938 | $165,005 |
| 2016 | $1,227 | $100,342 | $20,316 | $80,026 |
| 2015 | $1,227 | $89,264 | $0 | $0 |
| 2014 | -- | $89,264 | $0 | $0 |
Source: Public Records
Map
Nearby Homes
- 156 S 200 E
- 179 S 179 S 200 E
- 220 S Main St
- 175 E Vine St
- 268 E Vine St
- 47 S 3rd St
- 106 N 1st St
- 422 S Main St
- 141 N Pinehurst Ave
- 124 N 1st St
- 354 S 100 W
- 1757 N Patchwork Ave Unit 1262
- 1763 N Patchwork Ave Unit 1260
- 299 Sage Cir
- 274 Upland Dr
- 197 W 100 S
- 440 Highland Dr
- 77 N 4th St
- 543 S 50 W Unit 14
- 48 N 200 W
Your Personal Tour Guide
Ask me questions while you tour the home.