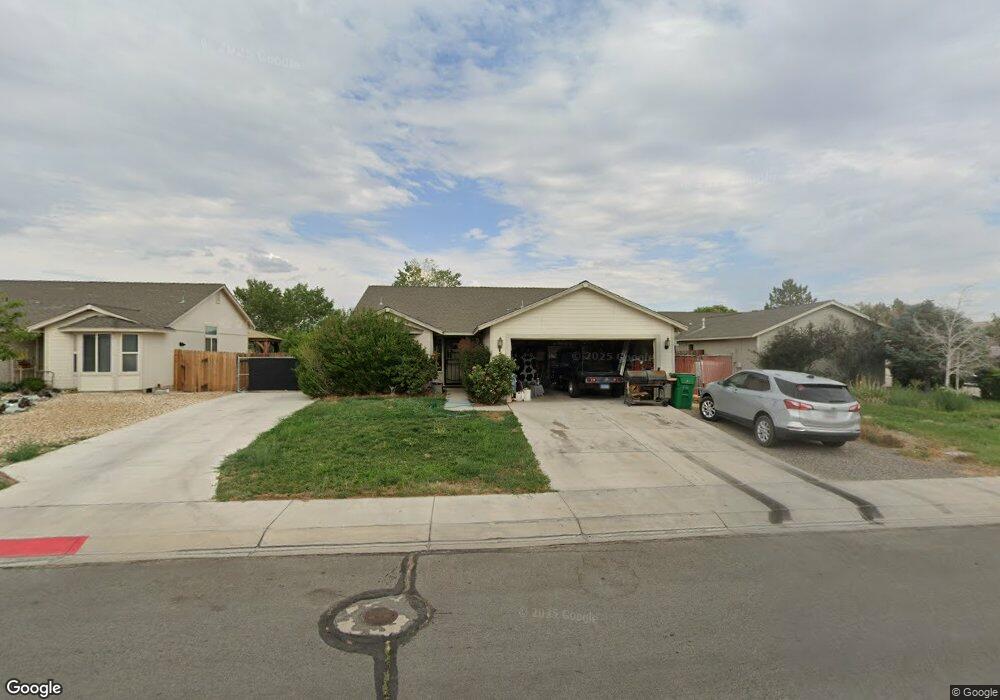
165 Shadow Mountain Dr Fernley, NV 89408
Estimated Value: $374,000 - $404,000
3
Beds
2
Baths
1,343
Sq Ft
$285/Sq Ft
Est. Value
About This Home
This home is located at 165 Shadow Mountain Dr, Fernley, NV 89408 and is currently estimated at $383,361, approximately $285 per square foot. 165 Shadow Mountain Dr is a home located in Lyon County with nearby schools including Cottonwood Elementary School, Fernley Intermediate School, and Fernley High School.
Ownership History
Date
Name
Owned For
Owner Type
Purchase Details
Closed on
Sep 29, 2020
Sold by
Paulsen Haley and Michael C Paulsen Trust
Bought by
Paulsen Haley
Current Estimated Value
Purchase Details
Closed on
Jul 26, 2006
Sold by
Paulsen Michael C
Bought by
Paulsen Michael C and Michael C Paulsen Trust
Purchase Details
Closed on
Jun 14, 2006
Sold by
Marciniak Jed T and Marciniak Melissa M
Bought by
Paulsen Michael C
Purchase Details
Closed on
Aug 22, 2005
Sold by
Hageman Melissa M and Marciniak Jed T
Bought by
Marciniak Jed T and Marciniak Melissa M
Home Financials for this Owner
Home Financials are based on the most recent Mortgage that was taken out on this home.
Original Mortgage
$170,400
Interest Rate
6.07%
Mortgage Type
New Conventional
Create a Home Valuation Report for This Property
The Home Valuation Report is an in-depth analysis detailing your home's value as well as a comparison with similar homes in the area
Home Values in the Area
Average Home Value in this Area
Purchase History
| Date | Buyer | Sale Price | Title Company |
|---|---|---|---|
| Paulsen Haley | -- | None Available | |
| Paulsen Michael C | -- | None Available | |
| Paulsen Michael C | $240,000 | Western Title Company Inc | |
| Marciniak Jed T | -- | Allince Title Company |
Source: Public Records
Mortgage History
| Date | Status | Borrower | Loan Amount |
|---|---|---|---|
| Previous Owner | Marciniak Jed T | $170,400 |
Source: Public Records
Tax History Compared to Growth
Tax History
| Year | Tax Paid | Tax Assessment Tax Assessment Total Assessment is a certain percentage of the fair market value that is determined by local assessors to be the total taxable value of land and additions on the property. | Land | Improvement |
|---|---|---|---|---|
| 2025 | $1,417 | $110,739 | $56,000 | $54,739 |
| 2024 | $1,785 | $111,252 | $56,000 | $55,252 |
| 2023 | $1,785 | $107,583 | $56,000 | $51,583 |
| 2022 | $1,679 | $103,581 | $56,000 | $47,581 |
| 2021 | $1,667 | $90,189 | $43,750 | $46,439 |
| 2020 | $1,626 | $88,242 | $43,750 | $44,492 |
| 2019 | $1,607 | $76,855 | $33,950 | $42,905 |
| 2018 | $1,575 | $64,617 | $22,750 | $41,867 |
| 2017 | $1,574 | $57,639 | $15,750 | $41,889 |
| 2016 | $1,390 | $46,456 | $7,880 | $38,576 |
| 2015 | $1,425 | $30,369 | $7,880 | $22,489 |
| 2014 | -- | $27,788 | $7,880 | $19,908 |
Source: Public Records
Map
Nearby Homes
- 698 Jenny's Ln
- 675 Warren Way
- 1505 Wrangler Ln
- 636 Brook Ln
- 1494 Mountain Rose Dr
- 870 Jennys Ln
- 1411 Shadow Ln
- 863 Jennys Ln
- 1525 Wrangler Ln
- 1224 Mountain Rose Dr
- 1405 Buckboard Way
- 2605 Emerson Cir
- 1165 Farm Ln
- 1165 Jenny's Ln
- 1687 Round up Rd
- 533 Dutch Oven Ct Unit 3
- 1671 Vista Moon Ct
- 1240-1250 Farm District Rd
- 572 Spur Way
- 465 Jennys Ln
- 167 Shadow Mountain Dr
- 163 Shadow Mountain Dr
- 158 Shadow Mountain Dr
- 169 Shadow Mountain Dr
- 161 Shadow Mountain Dr
- 156 Shadow Mountain Dr
- 690 Jennys Ln
- 694 Jennys Ln
- 696 Jennys Ln
- 154 Shadow Mountain Dr
- 157 Shadow Mountain Dr
- 686 Jennys Ln
- 155 Shadow Mountain Dr
- 682 Jennys Ln
- 152 Shadow Mountain Dr
- 667 Angela St
- 153 Shadow Mountain Dr
- 151 Shadow Mountain Dr
- 678 Jennys Ln
- 663 Angela St