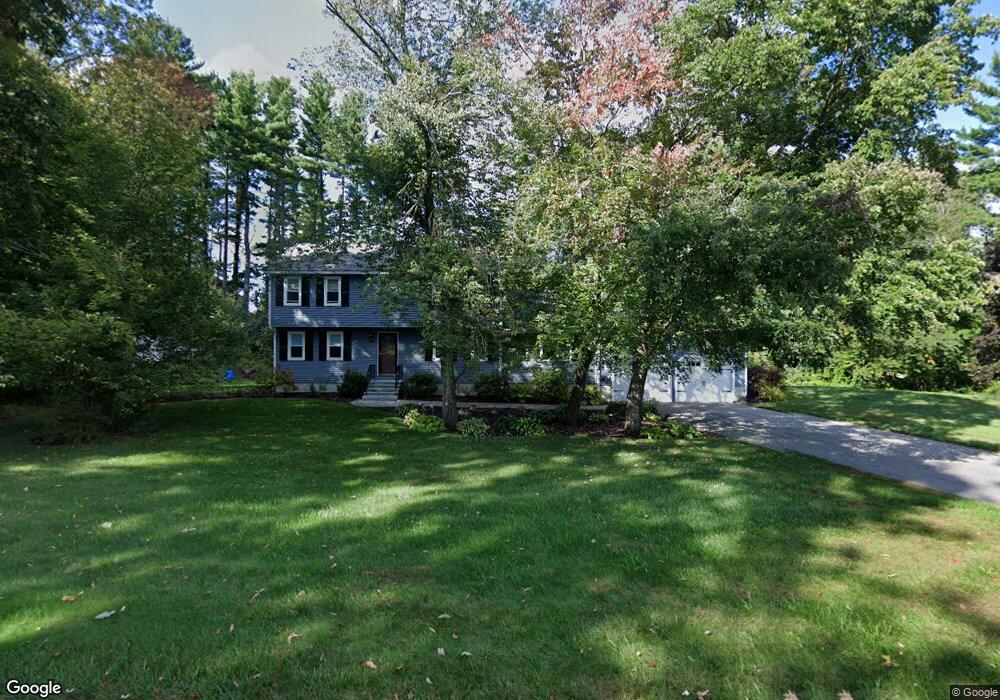
165 Spring Rd Dracut, MA 01826
Estimated Value: $590,537 - $663,000
3
Beds
3
Baths
1,232
Sq Ft
$509/Sq Ft
Est. Value
About This Home
This home is located at 165 Spring Rd, Dracut, MA 01826 and is currently estimated at $626,884, approximately $508 per square foot. 165 Spring Rd is a home located in Middlesex County with nearby schools including Joseph A. Campbell Elementary School, Richardson Middle School, and Dracut Senior High School.
Ownership History
Date
Name
Owned For
Owner Type
Purchase Details
Closed on
Jul 20, 2018
Sold by
Solar Ft
Bought by
Gallant James and Gallant Elizabeth
Current Estimated Value
Home Financials for this Owner
Home Financials are based on the most recent Mortgage that was taken out on this home.
Original Mortgage
$294,000
Outstanding Balance
$254,795
Interest Rate
4.5%
Mortgage Type
New Conventional
Estimated Equity
$372,089
Purchase Details
Closed on
Mar 6, 1974
Bought by
Endelos Brenda
Create a Home Valuation Report for This Property
The Home Valuation Report is an in-depth analysis detailing your home's value as well as a comparison with similar homes in the area
Home Values in the Area
Average Home Value in this Area
Purchase History
| Date | Buyer | Sale Price | Title Company |
|---|---|---|---|
| Gallant James | $367,500 | -- | |
| Endelos Brenda | -- | -- |
Source: Public Records
Mortgage History
| Date | Status | Borrower | Loan Amount |
|---|---|---|---|
| Open | Gallant James | $294,000 |
Source: Public Records
Tax History Compared to Growth
Tax History
| Year | Tax Paid | Tax Assessment Tax Assessment Total Assessment is a certain percentage of the fair market value that is determined by local assessors to be the total taxable value of land and additions on the property. | Land | Improvement |
|---|---|---|---|---|
| 2025 | $5,573 | $550,700 | $232,800 | $317,900 |
| 2024 | $5,657 | $541,300 | $221,900 | $319,400 |
| 2023 | $5,755 | $497,000 | $193,000 | $304,000 |
| 2022 | $5,298 | $431,100 | $175,600 | $255,500 |
| 2021 | $5,114 | $393,100 | $159,500 | $233,600 |
| 2020 | $6,530 | $361,900 | $154,700 | $207,200 |
| 2019 | $4,829 | $351,200 | $147,300 | $203,900 |
| 2018 | $10,067 | $331,000 | $147,300 | $183,700 |
| 2017 | $21,135 | $331,000 | $147,300 | $183,700 |
| 2016 | $4,321 | $291,200 | $141,600 | $149,600 |
| 2015 | $4,186 | $280,400 | $141,600 | $138,800 |
| 2014 | $3,995 | $275,700 | $141,600 | $134,100 |
Source: Public Records
Map
Nearby Homes
- 280 & 290 Spring Rd
- 351 Peters Pond Dr
- 96 Harris St
- 290 Salem Rd
- 5 Bailey Rd
- 298 Salem Rd
- 302 Salem Rd
- 2 S Shore Dr
- 25 Newbury Rd
- 6 Newbury Rd
- 6 Newbury Rd Unit M18 B12-16 L7
- 3 Carmel Rd
- 3 Kennedy Dr
- Lot 4 Canterbury Rd Unit 4
- 54 Methuen Rd
- 9 Quail Run Dr
- 45 Dutton Rd
- 26 Plower Rd Unit 6
- 39 Ticklefancy Ln
- 2 Westwind Dr