Estimated Value: $396,000 - $567,000
2
Beds
2
Baths
1,072
Sq Ft
$424/Sq Ft
Est. Value
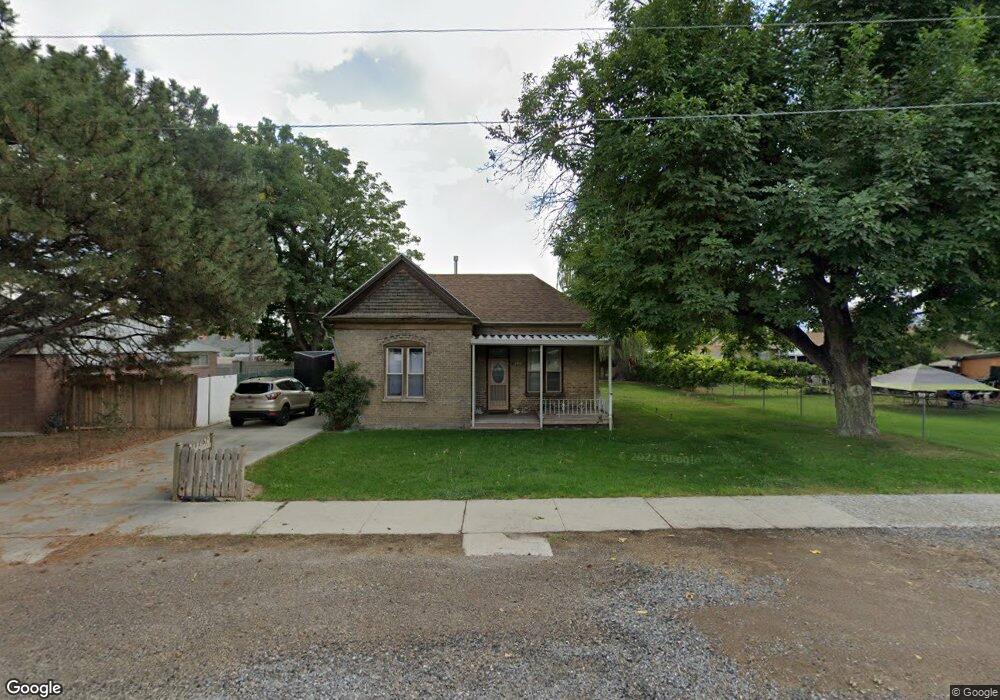
About This Home
This home is located at 165 W 100 N, Lehi, UT 84043 and is currently estimated at $454,410, approximately $423 per square foot. 165 W 100 N is a home located in Utah County with nearby schools including Lehi Elementary School, Lehi Junior High School, and Lehi High School.
Ownership History
Date
Name
Owned For
Owner Type
Purchase Details
Closed on
Dec 2, 2022
Sold by
Wilkin Elaine Whitener Morr
Bought by
Morrill Troy C and Morrill Tammy L
Current Estimated Value
Purchase Details
Closed on
May 4, 2018
Sold by
Wrikin Nile George and Wilkin Elanic Morill
Bought by
Wilkin Elanic Morrill
Purchase Details
Closed on
Jun 10, 2011
Sold by
Hazford Properties Llc
Bought by
Wilkin Nile George and Wilkin Scott Nile
Purchase Details
Closed on
May 9, 2011
Sold by
Wilkin Nile George
Bought by
Wilkin Nile George and Wilkin Scott Nile
Purchase Details
Closed on
Sep 19, 2001
Sold by
Wilkin Nile G and Wilkin Elaine Morrill
Bought by
Wilkin Nile G and Wilkin Elaine Morrill
Purchase Details
Closed on
Aug 2, 2001
Sold by
Wilkin Nile G and Wilkin Elaine Morrill
Bought by
Wilkin Nile G and Wilkin Elaine Morrill
Purchase Details
Closed on
Sep 7, 2000
Sold by
Wilkin Nile G
Bought by
Wilkin Nile G and Wilkin Elaine Morrill
Purchase Details
Closed on
Apr 4, 1996
Sold by
Webb Donald Ed and Webb Sandee K
Bought by
Wilkin Nile G and Wilkin Elaine Morrill
Create a Home Valuation Report for This Property
The Home Valuation Report is an in-depth analysis detailing your home's value as well as a comparison with similar homes in the area
Home Values in the Area
Average Home Value in this Area
Purchase History
| Date | Buyer | Sale Price | Title Company |
|---|---|---|---|
| Morrill Troy C | -- | Land Title | |
| Wilkin Elanic Morrill | -- | None Available | |
| Wilkin Nile George | -- | Backman | |
| Wilkin Nile George | -- | None Available | |
| Wilkin Nile G | -- | -- | |
| Wilkin Nile G | -- | -- | |
| Wilkin Nile G | -- | -- | |
| Wilkin Nile G | -- | -- |
Source: Public Records
Tax History Compared to Growth
Tax History
| Year | Tax Paid | Tax Assessment Tax Assessment Total Assessment is a certain percentage of the fair market value that is determined by local assessors to be the total taxable value of land and additions on the property. | Land | Improvement |
|---|---|---|---|---|
| 2025 | $1,553 | $201,905 | $237,100 | $130,000 |
| 2024 | $1,553 | $181,720 | $0 | $0 |
| 2023 | $1,385 | $176,000 | $0 | $0 |
| 2022 | $1,236 | $152,240 | $0 | $0 |
| 2021 | $1,021 | $190,100 | $116,900 | $73,200 |
| 2020 | $959 | $176,600 | $108,200 | $68,400 |
| 2019 | $876 | $167,700 | $108,200 | $59,500 |
| 2018 | $876 | $158,500 | $99,000 | $59,500 |
| 2017 | $1,112 | $106,975 | $0 | $0 |
| 2016 | $878 | $78,375 | $0 | $0 |
| 2015 | $925 | $78,375 | $0 | $0 |
| 2014 | $914 | $77,000 | $0 | $0 |
Source: Public Records
Map
Nearby Homes