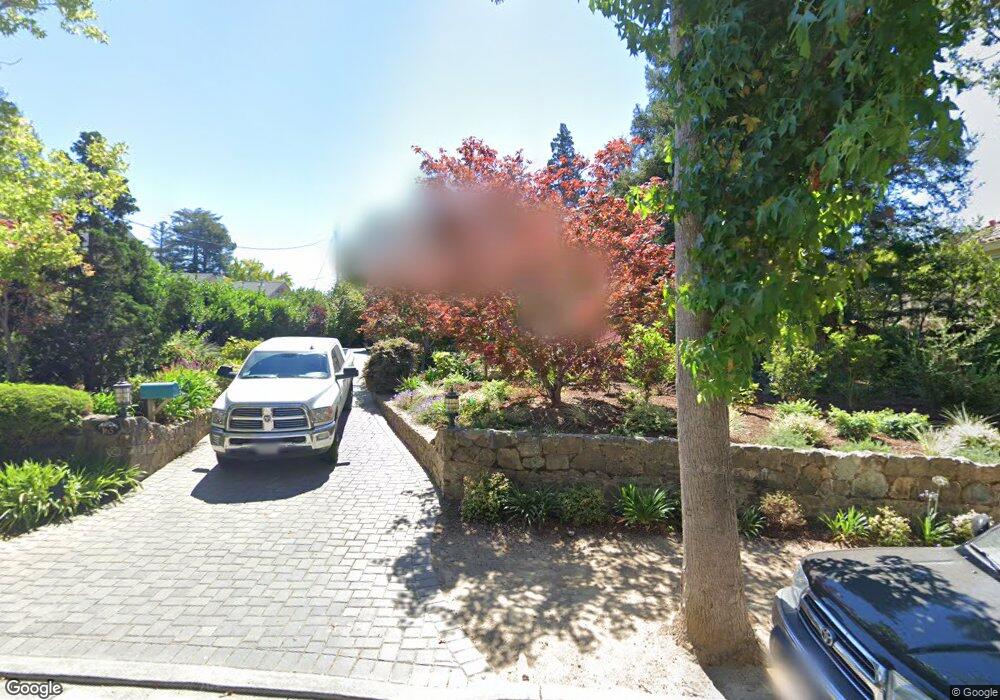
165 Warren Rd San Mateo, CA 94401
San Mateo Park NeighborhoodEstimated Value: $4,668,000 - $6,865,766
5
Beds
4
Baths
4,350
Sq Ft
$1,412/Sq Ft
Est. Value
About This Home
This home is located at 165 Warren Rd, San Mateo, CA 94401 and is currently estimated at $6,140,692, approximately $1,411 per square foot. 165 Warren Rd is a home located in San Mateo County with nearby schools including San Mateo Park Elementary, Borel Middle School, and San Mateo High School.
Ownership History
Date
Name
Owned For
Owner Type
Purchase Details
Closed on
Nov 7, 2007
Sold by
Bligh Bruce W and Bligh Kelly A
Bought by
Cross Elizabeth T and Stayner Anthony G
Current Estimated Value
Home Financials for this Owner
Home Financials are based on the most recent Mortgage that was taken out on this home.
Original Mortgage
$1,400,000
Outstanding Balance
$884,420
Interest Rate
6.35%
Mortgage Type
Purchase Money Mortgage
Estimated Equity
$5,256,272
Purchase Details
Closed on
Jun 28, 2006
Sold by
Bligh Bruce W and Bligh Kelly A
Bought by
Bligh Bruce W and Bligh Kelly A
Purchase Details
Closed on
Jul 29, 2004
Sold by
Brownlee David W and Brownlee Sally A
Bought by
Bligh Bruce W and Bligh Kelly A
Home Financials for this Owner
Home Financials are based on the most recent Mortgage that was taken out on this home.
Original Mortgage
$1,300,000
Interest Rate
4.62%
Mortgage Type
Purchase Money Mortgage
Create a Home Valuation Report for This Property
The Home Valuation Report is an in-depth analysis detailing your home's value as well as a comparison with similar homes in the area
Home Values in the Area
Average Home Value in this Area
Purchase History
| Date | Buyer | Sale Price | Title Company |
|---|---|---|---|
| Cross Elizabeth T | $3,950,000 | First American Title Co | |
| Bligh Bruce W | -- | None Available | |
| Bligh Bruce W | $2,875,000 | North American Title Co |
Source: Public Records
Mortgage History
| Date | Status | Borrower | Loan Amount |
|---|---|---|---|
| Open | Cross Elizabeth T | $1,400,000 | |
| Previous Owner | Bligh Bruce W | $1,300,000 | |
| Closed | Bligh Bruce W | $1,000,000 |
Source: Public Records
Tax History Compared to Growth
Tax History
| Year | Tax Paid | Tax Assessment Tax Assessment Total Assessment is a certain percentage of the fair market value that is determined by local assessors to be the total taxable value of land and additions on the property. | Land | Improvement |
|---|---|---|---|---|
| 2025 | $59,479 | $5,188,400 | $2,594,200 | $2,594,200 |
| 2023 | $59,479 | $4,986,930 | $2,493,465 | $2,493,465 |
| 2022 | $58,331 | $4,889,148 | $2,444,574 | $2,444,574 |
| 2021 | $60,788 | $4,793,284 | $2,396,642 | $2,396,642 |
| 2020 | $56,194 | $4,744,136 | $2,372,068 | $2,372,068 |
| 2019 | $54,624 | $4,651,114 | $2,325,557 | $2,325,557 |
| 2018 | $52,670 | $4,559,916 | $2,279,958 | $2,279,958 |
| 2017 | $47,417 | $4,100,000 | $2,050,000 | $2,050,000 |
| 2016 | $47,194 | $4,100,000 | $2,050,000 | $2,050,000 |
| 2015 | $45,300 | $3,900,000 | $1,950,000 | $1,950,000 |
| 2014 | $45,138 | $3,750,000 | $1,875,000 | $1,875,000 |
Source: Public Records
Map
Nearby Homes
- 215 Warren Rd
- 343 Warren Rd
- 828 N El Camino Real Unit 9
- 626 Occidental Ave
- 635 Occidental Ave
- 110 Park Rd Unit 101
- 828 Highland Ave
- 425 N El Camino Real Unit 203
- 425 N El Camino Real Unit 308
- 720 Brewer Dr
- 245 Grand Blvd
- 245 W Santa Inez Ave
- 320 Villa Terrace
- 420 Williams Place
- 845 Woodside Way Unit 111
- 847 Woodside Way Unit 218
- 315 Grand Blvd
- 321 Grand Blvd
- 119 E Poplar Ave
- 720 N San Mateo Dr