Estimated Value: $396,618 - $448,000
4
Beds
3
Baths
2,912
Sq Ft
$142/Sq Ft
Est. Value
About This Home
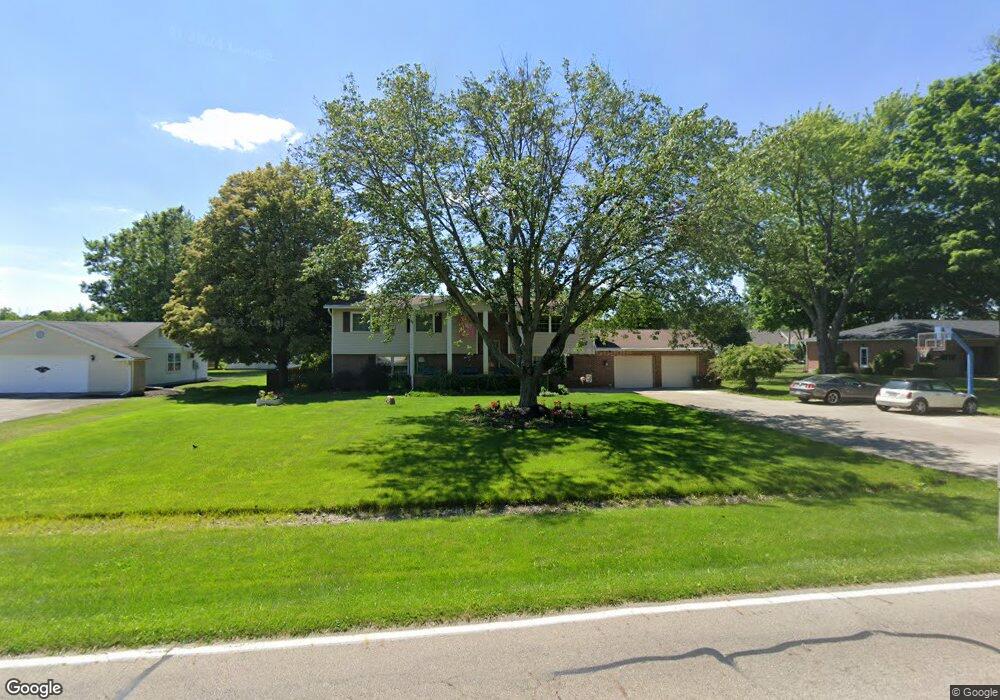
This home is located at 1650 Barnhart Rd, Troy, OH 45373 and is currently estimated at $414,655, approximately $142 per square foot. 1650 Barnhart Rd is a home located in Miami County with nearby schools including Concord Elementary School, Van Cleve Elementary School, and Troy Junior High School.
Ownership History
Date
Name
Owned For
Owner Type
Purchase Details
Closed on
Sep 2, 2016
Sold by
Kreinbrink Eric L and Kreinbrink Meisha A
Bought by
Harris Matthew and Harris Sheila J
Current Estimated Value
Purchase Details
Closed on
Mar 14, 2012
Sold by
Kreinbrink Erik L and Kreinbrink Meisha A
Bought by
Kreinbrink Erik L and Kreinbrink Meisha A
Purchase Details
Closed on
Jan 23, 2006
Sold by
Kreihbrink Eric L and Kreihbrink Meisha A
Bought by
Kreihbrink Eric L and Kreihbrink Meisha A
Purchase Details
Closed on
Apr 3, 2001
Sold by
Traughber C Wayne and Lynn Traughber C
Bought by
Kreinbrink Eric L and Kreinbrink Meisha A
Home Financials for this Owner
Home Financials are based on the most recent Mortgage that was taken out on this home.
Original Mortgage
$148,200
Interest Rate
7.02%
Mortgage Type
New Conventional
Purchase Details
Closed on
Jan 1, 1990
Bought by
Traughber C Wayne
Create a Home Valuation Report for This Property
The Home Valuation Report is an in-depth analysis detailing your home's value as well as a comparison with similar homes in the area
Purchase History
| Date | Buyer | Sale Price | Title Company |
|---|---|---|---|
| Harris Matthew | $224,400 | Attorney | |
| Kreinbrink Erik L | -- | -- | |
| Kreihbrink Eric L | -- | -- | |
| Kreinbrink Eric L | $156,000 | -- | |
| Traughber C Wayne | -- | -- |
Source: Public Records
Mortgage History
| Date | Status | Borrower | Loan Amount |
|---|---|---|---|
| Previous Owner | Kreinbrink Eric L | $148,200 |
Source: Public Records
Tax History
| Year | Tax Paid | Tax Assessment Tax Assessment Total Assessment is a certain percentage of the fair market value that is determined by local assessors to be the total taxable value of land and additions on the property. | Land | Improvement |
|---|---|---|---|---|
| 2025 | $4,334 | $121,490 | $20,340 | $101,150 |
| 2024 | $4,334 | $95,560 | $21,180 | $74,380 |
| 2023 | $3,718 | $95,560 | $21,180 | $74,380 |
| 2022 | $3,115 | $95,560 | $21,180 | $74,380 |
| 2021 | $2,655 | $76,440 | $16,940 | $59,500 |
| 2020 | $2,657 | $76,440 | $16,940 | $59,500 |
| 2019 | $2,681 | $76,440 | $16,940 | $59,500 |
| 2018 | $2,268 | $61,640 | $15,680 | $45,960 |
| 2017 | $2,289 | $61,640 | $15,680 | $45,960 |
| 2016 | $2,258 | $61,640 | $15,680 | $45,960 |
| 2015 | $2,177 | $57,090 | $14,530 | $42,560 |
| 2014 | $2,177 | $57,090 | $14,530 | $42,560 |
| 2013 | $2,191 | $57,090 | $14,530 | $42,560 |
Source: Public Records
Map
Nearby Homes
- 1595 Fox Run
- 2385 Worthington Dr
- 1345 Kenton Way
- 1371 Edinburgh Dr
- 2778 Southside Dr
- 1811 Greenbriar Dr
- 1181 Winchester Dr
- 2880 Manor Ct
- 2927 Huntington Dr
- 2924 Huntington Dr
- 1369 Goldenrod Dr
- 2972 Huntington Dr
- 1432 Goldenrod Dr
- 1464 Goldenrod Dr
- 1470 Goldenrod Dr
- 2904 Hoying Dr
- 612 Barnhart Rd
- 2863 Netherfield Cir
- 2928 Hoying Dr
- 2944 Hoying Dr
- 1634 Barnhart Rd
- 1670 Barnhart Rd
- 2314 Worthington Dr
- 2320 Worthington Dr
- 2310 Worthington Dr
- 1616 Barnhart Rd
- 1655 Barnhart Rd
- 1690 Barnhart Rd
- 1675 Barnhart Rd
- 2324 Worthington Dr
- 2300 Worthington Dr
- 1695 Barnhart Rd
- 1615 Barnhart Rd
- 2330 Worthington Dr
- 2315 Worthington Dr
- 2325 Worthington Dr
- 2311 Worthington Dr
- 2160 Canterbury Ct
- 1590 Barnhart Rd
- 1495 Fox Run
Your Personal Tour Guide
Ask me questions while you tour the home.