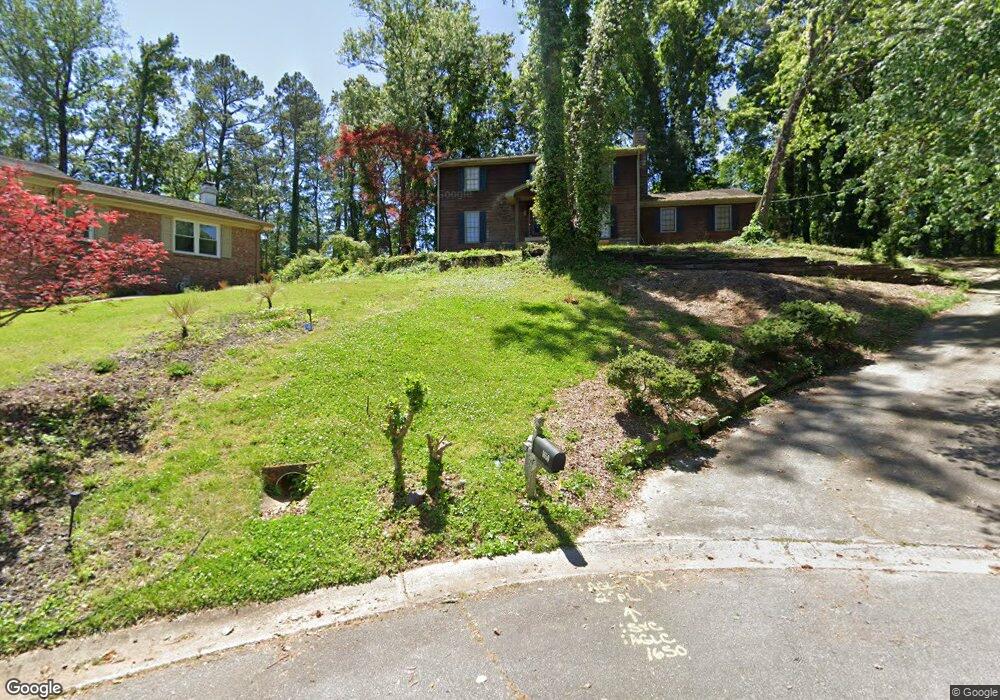
1650 Cedar Grove Dr Marietta, GA 30066
Sandy Plains NeighborhoodEstimated Value: $447,000 - $499,000
4
Beds
3
Baths
2,630
Sq Ft
$175/Sq Ft
Est. Value
About This Home
This home is located at 1650 Cedar Grove Dr, Marietta, GA 30066 and is currently estimated at $460,162, approximately $174 per square foot. 1650 Cedar Grove Dr is a home located in Cobb County with nearby schools including Addison Elementary School, Daniell Middle School, and Sprayberry High School.
Ownership History
Date
Name
Owned For
Owner Type
Purchase Details
Closed on
May 20, 2009
Sold by
Nomura Inc Series 2006-Fm2
Bought by
Jacques Chris A
Current Estimated Value
Home Financials for this Owner
Home Financials are based on the most recent Mortgage that was taken out on this home.
Original Mortgage
$139,906
Outstanding Balance
$88,205
Interest Rate
4.89%
Mortgage Type
FHA
Estimated Equity
$371,957
Purchase Details
Closed on
Mar 3, 2009
Sold by
Tadssc Samson
Bought by
Hsbc Bank Usa Na
Purchase Details
Closed on
May 9, 2006
Sold by
Ridgeway Anne
Bought by
Tadesse Samson
Home Financials for this Owner
Home Financials are based on the most recent Mortgage that was taken out on this home.
Original Mortgage
$196,000
Interest Rate
8.65%
Mortgage Type
New Conventional
Purchase Details
Closed on
Jan 13, 2006
Sold by
Foster Janet H
Bought by
Ridgeway Anne
Create a Home Valuation Report for This Property
The Home Valuation Report is an in-depth analysis detailing your home's value as well as a comparison with similar homes in the area
Home Values in the Area
Average Home Value in this Area
Purchase History
| Date | Buyer | Sale Price | Title Company |
|---|---|---|---|
| Jacques Chris A | $142,500 | -- | |
| Hsbc Bank Usa Na | $88,400 | -- | |
| Tadesse Samson | $245,000 | -- | |
| Ridgeway Anne | $209,000 | -- |
Source: Public Records
Mortgage History
| Date | Status | Borrower | Loan Amount |
|---|---|---|---|
| Open | Jacques Chris A | $139,906 | |
| Previous Owner | Tadesse Samson | $196,000 |
Source: Public Records
Tax History Compared to Growth
Tax History
| Year | Tax Paid | Tax Assessment Tax Assessment Total Assessment is a certain percentage of the fair market value that is determined by local assessors to be the total taxable value of land and additions on the property. | Land | Improvement |
|---|---|---|---|---|
| 2025 | $4,183 | $183,008 | $36,000 | $147,008 |
| 2024 | $4,187 | $183,008 | $36,000 | $147,008 |
| 2023 | $2,353 | $123,480 | $20,800 | $102,680 |
| 2022 | $2,918 | $123,480 | $20,800 | $102,680 |
| 2021 | $2,686 | $112,880 | $20,800 | $92,080 |
| 2020 | $2,217 | $91,452 | $20,800 | $70,652 |
| 2019 | $1,939 | $78,728 | $20,800 | $57,928 |
| 2018 | $1,835 | $74,000 | $20,800 | $53,200 |
| 2017 | $1,660 | $69,372 | $20,800 | $48,572 |
| 2016 | $1,611 | $67,060 | $20,800 | $46,260 |
| 2015 | $1,443 | $57,812 | $19,000 | $38,812 |
| 2014 | $1,455 | $57,812 | $0 | $0 |
Source: Public Records
Map
Nearby Homes
- 2314 Sandy Oaks Dr
- 2116 Morgan Rd NE
- 1505 Kincaid Rd
- 1780 Kinridge Rd
- 2020 Starlight Dr
- 1972 Granite Mill Rd
- 1748 Brown Cir
- 2725 Stillwater Lake Ln Unit 2
- Robie Plan at The Village at Sandy Plains
- Harbor Plan at The Village at Sandy Plains
- Hanover Plan at The Village at Sandy Plains
- Bowen Plan at The Village at Sandy Plains
- Elston Plan at The Village at Sandy Plains
- BALDWIN Plan at The Village at Sandy Plains
- 1850 Butterfly Way NE
- 2729 Stillwater Lake Ln Unit 1
- 1854 Butterfly Way
- 2065 Mozelle Dr
- 2252 Carefree Cir Unit 3
- 1838 Butterfly NE
- 1660 Cedar Grove Dr
- 2274 Wilderness Way
- 1645 Cedar Grove Dr
- 2282 Wilderness Way
- 2266 Wilderness Way
- 1670 Cedar Grove Dr
- 1655 Cedar Grove Dr
- 2290 Wilderness Way
- 1665 Whitlock Rd
- 1665 Cedar Grove Dr
- 1653 Whitlock Rd
- 1671 Whitlock Rd
- 1680 Cedar Grove Dr
- 2298 Wilderness Way Unit 1
- 1675 Cedar Grove Dr
- 2273 Wilderness Way Unit 1
- 2265 Wilderness Way
- 2289 Wilderness Way
- 2281 Wilderness Way
- 0 Cedar Grove Dr Unit 8878666