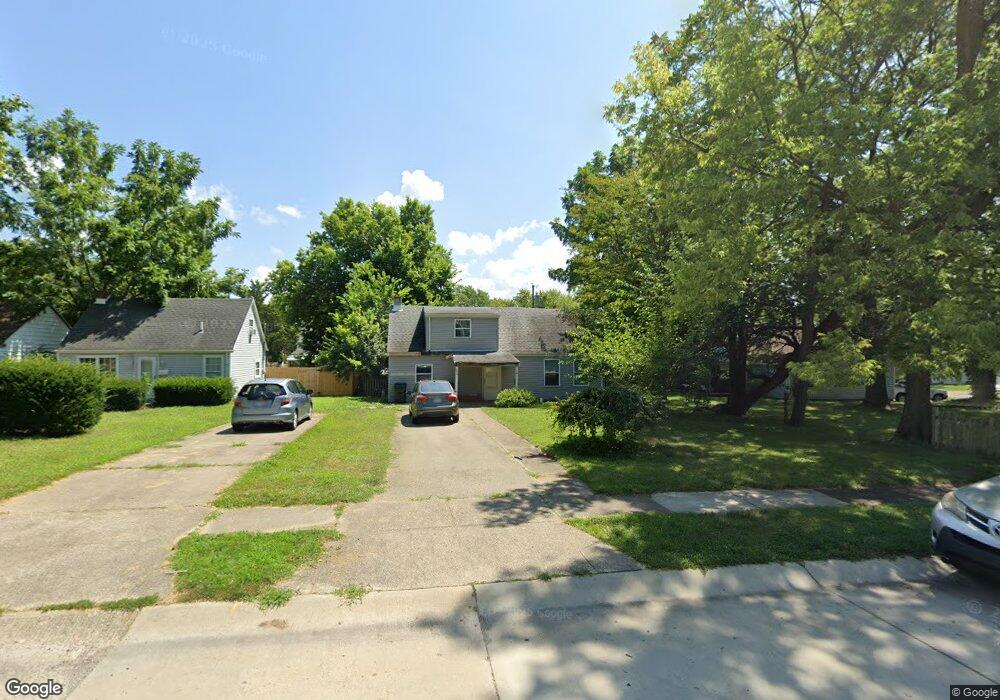
1650 Horlacher Ave Dayton, OH 45420
Estimated Value: $151,425 - $219,000
3
Beds
1
Bath
1,064
Sq Ft
$165/Sq Ft
Est. Value
About This Home
This home is located at 1650 Horlacher Ave, Dayton, OH 45420 and is currently estimated at $175,106, approximately $164 per square foot. 1650 Horlacher Ave is a home located in Montgomery County with nearby schools including Greenmont Elementary School, Kettering Middle School, and Kettering Fairmont High School.
Ownership History
Date
Name
Owned For
Owner Type
Purchase Details
Closed on
Oct 17, 2022
Sold by
Elmore Jeremy
Bought by
Copley Bridget N
Current Estimated Value
Home Financials for this Owner
Home Financials are based on the most recent Mortgage that was taken out on this home.
Original Mortgage
$121,754
Outstanding Balance
$117,147
Interest Rate
6.02%
Mortgage Type
FHA
Estimated Equity
$57,959
Purchase Details
Closed on
Sep 21, 2022
Sold by
Blue Prodigy Property Group Llc
Bought by
Elmore Jeremy
Home Financials for this Owner
Home Financials are based on the most recent Mortgage that was taken out on this home.
Original Mortgage
$121,754
Outstanding Balance
$117,147
Interest Rate
6.02%
Mortgage Type
FHA
Estimated Equity
$57,959
Purchase Details
Closed on
Dec 9, 2020
Sold by
Elmore Gregory
Bought by
Blue Prodigy Property Group Llc
Purchase Details
Closed on
Nov 2, 2001
Sold by
Breeze M Ruth Trustee
Bought by
Elmore Walter L
Purchase Details
Closed on
Jun 7, 1994
Sold by
Ruth Breeze M and Ruth Kaylor M
Bought by
Breeze M Ruth
Create a Home Valuation Report for This Property
The Home Valuation Report is an in-depth analysis detailing your home's value as well as a comparison with similar homes in the area
Home Values in the Area
Average Home Value in this Area
Purchase History
| Date | Buyer | Sale Price | Title Company |
|---|---|---|---|
| Copley Bridget N | $124,000 | -- | |
| Elmore Jeremy | -- | -- | |
| Blue Prodigy Property Group Llc | $60,000 | None Available | |
| Elmore Walter L | $43,000 | -- | |
| Breeze M Ruth | -- | -- |
Source: Public Records
Mortgage History
| Date | Status | Borrower | Loan Amount |
|---|---|---|---|
| Open | Copley Bridget N | $121,754 |
Source: Public Records
Tax History Compared to Growth
Tax History
| Year | Tax Paid | Tax Assessment Tax Assessment Total Assessment is a certain percentage of the fair market value that is determined by local assessors to be the total taxable value of land and additions on the property. | Land | Improvement |
|---|---|---|---|---|
| 2024 | $2,021 | $31,570 | $10,050 | $21,520 |
| 2023 | $2,021 | $31,570 | $10,050 | $21,520 |
| 2022 | $1,695 | $20,870 | $6,660 | $14,210 |
| 2021 | $1,572 | $20,870 | $6,660 | $14,210 |
| 2020 | $1,757 | $20,870 | $6,660 | $14,210 |
| 2019 | $1,491 | $17,430 | $6,660 | $10,770 |
| 2018 | $1,498 | $17,430 | $6,660 | $10,770 |
| 2017 | $1,385 | $17,430 | $6,660 | $10,770 |
| 2016 | $1,455 | $17,220 | $6,660 | $10,560 |
| 2015 | $1,393 | $17,220 | $6,660 | $10,560 |
| 2014 | $1,393 | $17,220 | $6,660 | $10,560 |
| 2012 | -- | $21,120 | $6,720 | $14,400 |
Source: Public Records
Map
Nearby Homes
- 1512 Horlacher Ave
- 1513 Horlacher Ave
- 1508 Horlacher Ave
- 2830 Kennedy Ave
- 1744 Woodman Dr
- 1840 Culver Ave
- 4802 Amesborough Rd
- 1914 W Bataan Dr
- 4643 Amesborough Rd
- 1910 Roop Place
- 1300 Watervliet Ave
- 4549 Amesborough Rd
- 1829 Hazel Ave
- 4527 Amesborough Rd
- 2040 Courtland Ave
- 1108 Chelsea Ave
- 2004 Hazel Ave
- 1025 Weng Ave
- 1542 Scottsdale Dr
- 1012 Chelsea Ave
- 00000 Flesher Ave
- 1644 Horlacher Ave
- 1651 Barney Ave
- 1645 Barney Ave
- 1655 Barney Ave
- 1634 Horlacher Ave
- 1661 Barney Ave
- 1651 Horlacher Ave
- 1620 Horlacher Ave
- 1700 Horlacher Ave
- 1635 Barney Ave
- 1655 Horlacher Ave
- 1641 Horlacher Ave
- 1661 Horlacher Ave
- 1621 Barney Ave
- 1635 Horlacher Ave
- 1614 Horlacher Ave
- 1704 Horlacher Ave
- 1701 Barney Ave
- 1916 Pauline Ave