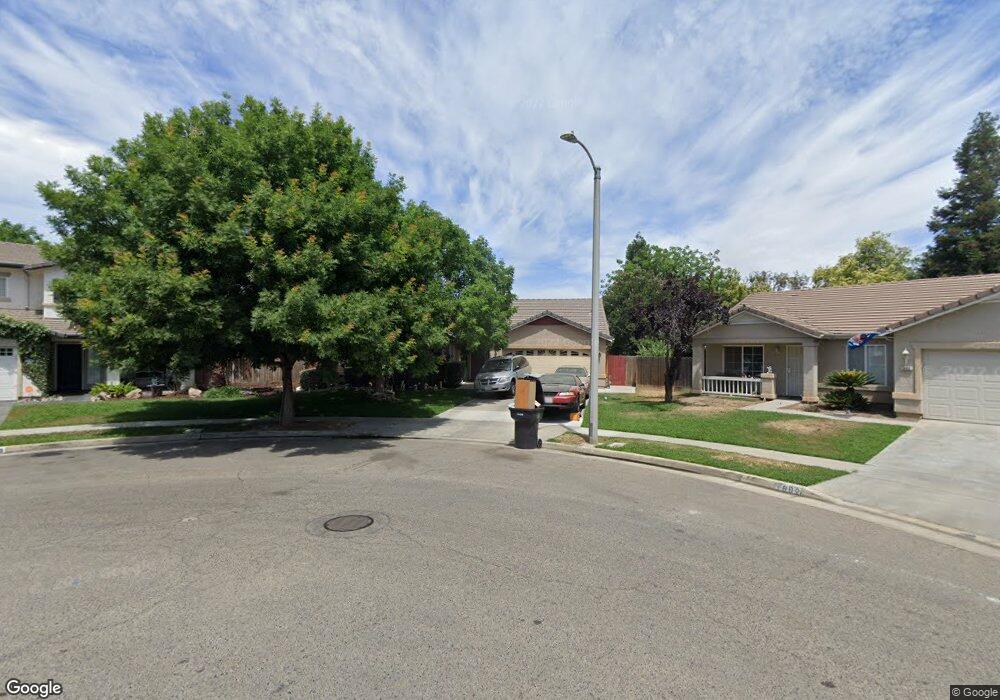
1650 Mt Whitney St Tulare, CA 93274
Tulare Southeast NeighborhoodEstimated Value: $385,000 - $432,000
4
Beds
2
Baths
1,995
Sq Ft
$202/Sq Ft
Est. Value
About This Home
This home is located at 1650 Mt Whitney St, Tulare, CA 93274 and is currently estimated at $403,345, approximately $202 per square foot. 1650 Mt Whitney St is a home located in Tulare County with nearby schools including Cypress Elementary School, Alpine Vista School, and Mission Oak High School.
Ownership History
Date
Name
Owned For
Owner Type
Purchase Details
Closed on
Aug 19, 2019
Sold by
Bravo Franklin
Bought by
Sanchez Asugey A
Current Estimated Value
Purchase Details
Closed on
Aug 5, 2019
Sold by
Sanchez Asugey A
Bought by
Correia Marvin and Correia Mary
Purchase Details
Closed on
Feb 10, 2010
Sold by
Eubank Guy
Bought by
Sanchez Asugey A
Home Financials for this Owner
Home Financials are based on the most recent Mortgage that was taken out on this home.
Original Mortgage
$166,920
Interest Rate
5.37%
Mortgage Type
FHA
Purchase Details
Closed on
Nov 17, 2006
Sold by
Potter Rachel Evelyn
Bought by
Eubank Guy and Eubank Jami
Home Financials for this Owner
Home Financials are based on the most recent Mortgage that was taken out on this home.
Original Mortgage
$256,405
Interest Rate
6.37%
Mortgage Type
New Conventional
Purchase Details
Closed on
Sep 19, 2002
Sold by
Centex Homes
Bought by
Potter Rachel Evelyn and The Rachel Evelyn Potter Trust
Create a Home Valuation Report for This Property
The Home Valuation Report is an in-depth analysis detailing your home's value as well as a comparison with similar homes in the area
Home Values in the Area
Average Home Value in this Area
Purchase History
| Date | Buyer | Sale Price | Title Company |
|---|---|---|---|
| Sanchez Asugey A | -- | First American Title | |
| Correia Marvin | -- | First American | |
| Sanchez Asugey A | $170,000 | Chicago Title Company | |
| Eubank Guy | $270,000 | Chicago Title Co | |
| Potter Rachel Evelyn | $154,000 | Commerce Title |
Source: Public Records
Mortgage History
| Date | Status | Borrower | Loan Amount |
|---|---|---|---|
| Previous Owner | Sanchez Asugey A | $166,920 | |
| Previous Owner | Eubank Guy | $256,405 |
Source: Public Records
Tax History Compared to Growth
Tax History
| Year | Tax Paid | Tax Assessment Tax Assessment Total Assessment is a certain percentage of the fair market value that is determined by local assessors to be the total taxable value of land and additions on the property. | Land | Improvement |
|---|---|---|---|---|
| 2025 | $3,202 | $289,813 | $65,617 | $224,196 |
| 2024 | $3,202 | $284,131 | $64,331 | $219,800 |
| 2023 | $3,124 | $278,561 | $63,070 | $215,491 |
| 2022 | $3,034 | $273,100 | $61,834 | $211,266 |
| 2021 | $2,973 | $267,746 | $60,622 | $207,124 |
| 2020 | $3,020 | $265,000 | $60,000 | $205,000 |
| 2019 | $2,349 | $196,717 | $46,286 | $150,431 |
| 2018 | $2,306 | $192,859 | $45,378 | $147,481 |
| 2017 | $2,285 | $189,077 | $44,488 | $144,589 |
| 2016 | $2,185 | $185,370 | $43,616 | $141,754 |
| 2015 | -- | $182,586 | $42,961 | $139,625 |
| 2014 | -- | $179,009 | $42,119 | $136,890 |
Source: Public Records
Map
Nearby Homes
- 1572 Jasmine Ct
- 1533 Etna Dr
- 1730 E Evergreen Ave
- 1625 S Lydia Dr
- 980 S Spruce St
- 931 S Amber St
- 900 S Ann St
- 860 S Kazarian St
- 2005 Mount Stewart Ave
- 716 S Kazarian St
- 1803 Durango Ct
- 1065 E Cedar Ave
- 752 S T St
- 1686 E Foster Dr
- 501 S Magnolia St
- 2570 Trapper Springs Ave
- 2671 Lakeridge Ave
- 2727 Eshom Creek Ct
- 434 Fallbrook Ct
- 2796 Azalea Ave
- 1650 Mount Whitney Ave
- 1692 Mount Whitney Ave
- 1203 Dalton St
- 1702 Mount Whitney Ave
- 1227 Dalton St
- 1718 Mount Whitney Ave
- 1151 S Laspina St
- 1220 Dalton St
- 1243 Dalton St
- 1145 -1149 Laspina
- 1149 Laspina
- 1732 Mount Whitney Ave
- 1145 S Laspina St
- 1248 Dalton St
- 1126 Cabrillo Dr
- 1101 Cabrillo Dr
- 1265 Dalton St
- 1729 Mount Whitney Ave
- 1744 Mount Whitney Ave
- 1233 S Laspina St