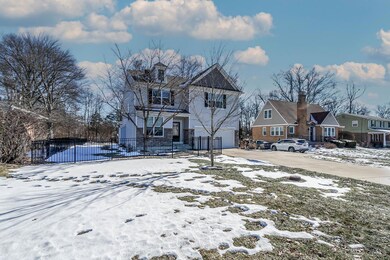
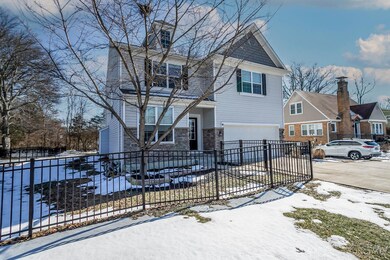
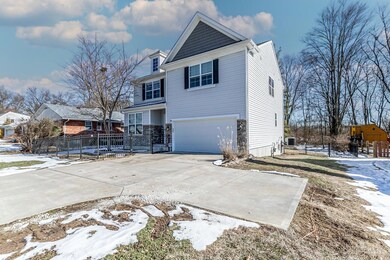
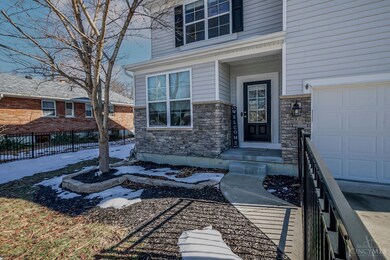
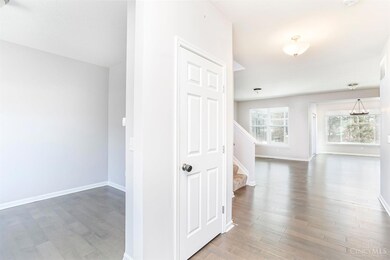
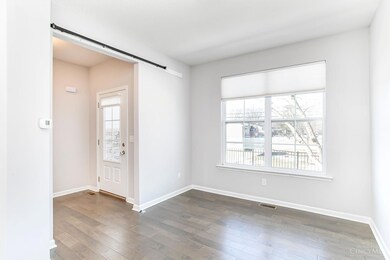
NOT LISTED FOR SALE

1650 Nagel Rd Cincinnati, OH 45255

Estimated Value: $462,000 - $472,000

4 Beds
3 Baths
2,582 Sq Ft
$181/Sq Ft Est. Value

About This Home

This home is located at 1650 Nagel Rd, Cincinnati, OH 45255 and is currently estimated at $467,268, approximately $180 per square foot. 1650 Nagel Rd is a home located in Hamilton County with nearby schools including Wilson Elementary School, Nagel Middle School, and Turpin High School.

Ownership History

Date Name Owned For Owner Type

Purchase Details

Closed on
Feb 28, 2025
Sold by
Mason Meredith B and Ramler Brian M
Bought by
Cossins Joseph and Rowley Carol
Current Estimated Value
$467,268

Home Financials for this Owner

Home Financials are based on the most recent Mortgage that was taken out on this home.
Original Mortgage
$378,400
Outstanding Balance
$378,092
Interest Rate
7.04%
Mortgage Type
New Conventional
Estimated Equity
$85,678

Purchase Details

Closed on
Oct 6, 2017
Sold by
Brookstone Homes Llc
Bought by
Meredith B Mason and Brian M Ramler

Home Financials for this Owner

Home Financials are based on the most recent Mortgage that was taken out on this home.
Interest Rate
3.85%

Purchase Details

Closed on
May 1, 2017
Sold by
H C Construction Llc
Bought by
Brookstone Homes Llc

Purchase Details

Closed on
Oct 31, 2013
Sold by
Mullaney Nathan J and Mullaney Theresa A
Bought by
Walters Eugene
Source: Public Records

Range of Values:

Collateral Analytics

Collateral Analytics Collateral Analytics AVMs (Automated Valuation Model) employ a number of statistical approaches combined with neighborhood-specific comparable selection guarantees the most up-to-date and precise valuations.

Not Available

Collateral Analytics does not have data for the current month. Please view the chart for historical values.

ICE

ICE Mortgage Technology ICE Mortgage Technology’s AVM (Automated Valuation Model) is a state-of-the-art online residential property valuation tool that provides a quick and accurate estimate of the value of almost any home in the U.S.

Not Available

ICE Mortgage Technology does not have data for the current month. Please view the chart for historical values.

First American

First American First American Data & Analytics’ next-generation AVM combines unrivaled data assets with a blended ensemble of valuation models to produce highly accurate, reliable valuations you can trust.

Not Available

First American does not have data for the current month. Please view the chart for historical values.

Quantarium

Quantarium Quantarium’s valuation service, repeatedly proven the industry’s most accurate and comprehensive, is supercharged with a self-learning and auto-tuning AI engine that continually becomes smarter and more accurate as it processes daily inputs from the industry’s leading RE data lake.

Not Available

Quantarium does not have data for the current month. Please view the chart for historical values.

Average Value
Not Available
List Price
Sold Price
Create a Home Valuation Report for This Property
The Home Valuation Report is an in-depth analysis detailing your home's value as well as a comparison with similar homes in the area

Home Values in the Area

Source: Public Records

Average Home Value in this Area


Source: Public Records

Purchase History

Date Buyer Sale Price Title Company
Cossins Joseph $473,000 Northwest Select Title
Meredith B Mason $303,923 --
Brookstone Homes Llc $45,000 Chicago Title Company Llc
Walters Eugene $30,000 Chase Legal Title Llc
Source: Public Records

Mortgage History

Date Status Borrower Loan Amount
Open Cossins Joseph $378,400
Closed Cossins Joseph $378,400
Previous Owner Ramler Meredith $206,000
Previous Owner Meredith B Mason --
Source: Public Records

Tax History Compared to Growth

Source: Public Records

Tax History

Year Tax Paid Tax Assessment Tax Assessment Total Assessment is a certain percentage of the fair market value that is determined by local assessors to be the total taxable value of land and additions on the property. Land Improvement
2024 $8,494 $139,819 $17,357 $122,462
2023 $8,079 $139,819 $17,357 $122,462
2022 $6,903 $106,373 $16,944 $89,429
2021 $6,740 $106,373 $16,944 $89,429
2020 $6,817 $106,373 $16,944 $89,429
2019 $7,492 $106,372 $13,888 $92,484
2018 $7,246 $13,888 $13,888 $0
2017 $904 $13,888 $13,888 $0
2016 $942 $14,000 $14,000 $0
2015 $907 $14,000 $14,000 $0
2014 $906 $14,000 $14,000 $0
2013 $834 $13,584 $13,584 $0
Source: Public Records

Map