1650 Sonoma Ct Montrose, CO 81401
Estimated Value: $307,000 - $354,000
2
Beds
2
Baths
1,354
Sq Ft
$239/Sq Ft
Est. Value
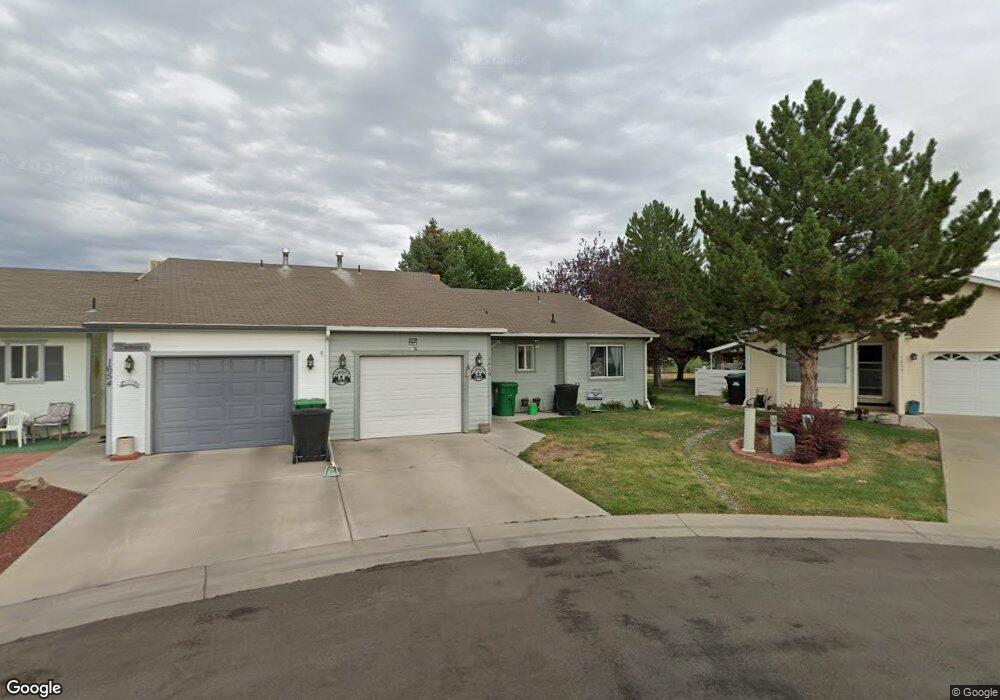
About This Home
This home is located at 1650 Sonoma Ct, Montrose, CO 81401 and is currently estimated at $323,721, approximately $239 per square foot. 1650 Sonoma Ct is a home located in Montrose County with nearby schools including Cottonwood Elementary School, Columbine Middle School, and Montrose High School.
Ownership History
Date
Name
Owned For
Owner Type
Purchase Details
Closed on
Jul 20, 2009
Sold by
Pierson Randy Ray and Pierson John Rex
Bought by
Franklin Ashley N
Current Estimated Value
Home Financials for this Owner
Home Financials are based on the most recent Mortgage that was taken out on this home.
Original Mortgage
$129,900
Outstanding Balance
$86,487
Interest Rate
5.71%
Mortgage Type
New Conventional
Estimated Equity
$237,234
Purchase Details
Closed on
Oct 17, 2008
Sold by
Pierson Randy Ray
Bought by
Pierson Randy Ray and Pierson John Rex
Purchase Details
Closed on
Jul 16, 1996
Sold by
Waehner Kenneth A and Waehner Betty
Bought by
Pierson Mary Lou
Purchase Details
Closed on
Oct 25, 1993
Sold by
Highlife Homes Of Montrose
Bought by
Waehner Kenneth A and Waehner Betty M
Purchase Details
Closed on
Aug 6, 1993
Sold by
B E S Inc
Bought by
Highlife Homes Of Montrose
Create a Home Valuation Report for This Property
The Home Valuation Report is an in-depth analysis detailing your home's value as well as a comparison with similar homes in the area
Home Values in the Area
Average Home Value in this Area
Purchase History
| Date | Buyer | Sale Price | Title Company |
|---|---|---|---|
| Franklin Ashley N | $129,900 | Land Title Guarantee Company | |
| Pierson Randy Ray | -- | None Available | |
| Pierson Mary Lou | $91,000 | -- | |
| Waehner Kenneth A | $81,500 | -- | |
| Highlife Homes Of Montrose | $10,000 | -- |
Source: Public Records
Mortgage History
| Date | Status | Borrower | Loan Amount |
|---|---|---|---|
| Open | Franklin Ashley N | $129,900 |
Source: Public Records
Tax History Compared to Growth
Tax History
| Year | Tax Paid | Tax Assessment Tax Assessment Total Assessment is a certain percentage of the fair market value that is determined by local assessors to be the total taxable value of land and additions on the property. | Land | Improvement |
|---|---|---|---|---|
| 2024 | $1,132 | $15,700 | $2,710 | $12,990 |
| 2023 | $1,132 | $20,120 | $3,480 | $16,640 |
| 2022 | $1,034 | $14,810 | $2,430 | $12,380 |
| 2021 | $1,064 | $15,230 | $2,500 | $12,730 |
| 2020 | $802 | $11,790 | $2,070 | $9,720 |
| 2019 | $807 | $11,790 | $2,070 | $9,720 |
| 2018 | $660 | $9,400 | $1,670 | $7,730 |
| 2017 | $655 | $9,400 | $1,670 | $7,730 |
| 2016 | $665 | $9,700 | $1,610 | $8,090 |
| 2015 | $653 | $9,700 | $1,610 | $8,090 |
| 2014 | $535 | $8,500 | $1,610 | $6,890 |
Source: Public Records
Map
Nearby Homes
- 1691 Rheims Ct
- 1686 Rheims Ct
- 1600 Arland Rd Unit 3
- 1649 Hermosa St
- 0 E Oak Grove Rd
- Tract A & 3 E Oak Grove Rd
- Tract 3 E Oak Grove Rd
- Tract A, 3 Lot2 E Oak Grove Rd
- Tract A E Oak Grove Rd
- Lot 2 E Oak Grove Rd
- Lot 5 TBD E Oak Grove Rd
- TBD Lot 1 E Oak Grove Rd
- 1649 Sneffels St
- 1951 Dubonnet Ct
- 2669 Lone Cone Ave
- 2707 Abrams Ave
- TBD Odelle Rd
- Lot 2403 Fellows Dr
- Lot 2305 Painted Wall Ln
- TBD Montrose Dr Site C