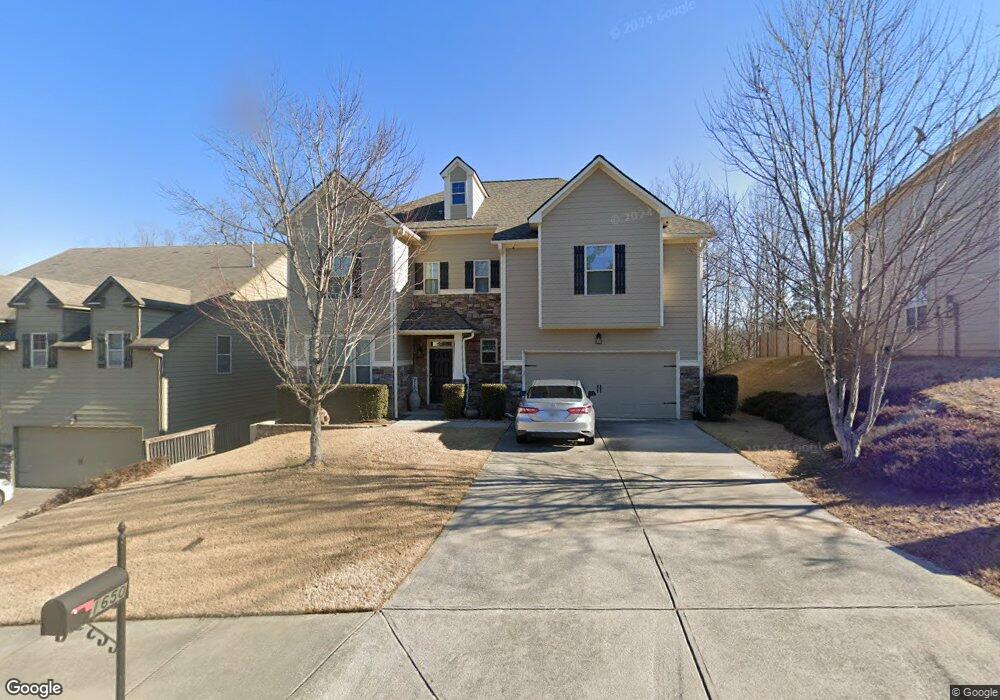
1650 Sugar Ridge Dr Suwanee, GA 30024
Estimated Value: $651,000 - $718,000
4
Beds
3
Baths
3,509
Sq Ft
$193/Sq Ft
Est. Value
About This Home
This home is located at 1650 Sugar Ridge Dr, Suwanee, GA 30024 and is currently estimated at $677,375, approximately $193 per square foot. 1650 Sugar Ridge Dr is a home located in Forsyth County with nearby schools including Settles Bridge Elementary School, Riverwatch Middle School, and Lambert High School.
Ownership History
Date
Name
Owned For
Owner Type
Purchase Details
Closed on
May 17, 2024
Sold by
Panigrahi Santosh Kumar
Bought by
Panigrahi Santosh Kumar and Mahapatra Srnaraki
Current Estimated Value
Home Financials for this Owner
Home Financials are based on the most recent Mortgage that was taken out on this home.
Original Mortgage
$467,250
Outstanding Balance
$460,698
Interest Rate
6.88%
Mortgage Type
New Conventional
Estimated Equity
$216,677
Purchase Details
Closed on
Oct 24, 2012
Sold by
Adc Riverbrooke Llc
Bought by
Devita Robert
Home Financials for this Owner
Home Financials are based on the most recent Mortgage that was taken out on this home.
Original Mortgage
$64,695
Interest Rate
3.42%
Mortgage Type
New Conventional
Purchase Details
Closed on
Jul 11, 2012
Sold by
Atl 1Q11 Adc Llc
Bought by
Adc Riverbrooke Llc
Create a Home Valuation Report for This Property
The Home Valuation Report is an in-depth analysis detailing your home's value as well as a comparison with similar homes in the area
Home Values in the Area
Average Home Value in this Area
Purchase History
| Date | Buyer | Sale Price | Title Company |
|---|---|---|---|
| Panigrahi Santosh Kumar | -- | None Listed On Document | |
| Panigrahi Santosh Kumar | $667,500 | None Listed On Document | |
| Panigrahi Santosh Kumar | $667,500 | None Listed On Document | |
| Devita Robert | $227,695 | -- | |
| Adc Riverbrooke Llc | -- | -- |
Source: Public Records
Mortgage History
| Date | Status | Borrower | Loan Amount |
|---|---|---|---|
| Open | Panigrahi Santosh Kumar | $467,250 | |
| Closed | Panigrahi Santosh Kumar | $467,250 | |
| Previous Owner | Devita Robert | $64,695 |
Source: Public Records
Tax History Compared to Growth
Tax History
| Year | Tax Paid | Tax Assessment Tax Assessment Total Assessment is a certain percentage of the fair market value that is determined by local assessors to be the total taxable value of land and additions on the property. | Land | Improvement |
|---|---|---|---|---|
| 2025 | $4,726 | $262,480 | $80,000 | $182,480 |
| 2024 | $4,726 | $240,944 | $66,000 | $174,944 |
| 2023 | $4,079 | $222,804 | $54,000 | $168,804 |
| 2022 | $4,174 | $140,360 | $32,000 | $108,360 |
| 2021 | $3,442 | $140,360 | $32,000 | $108,360 |
| 2020 | $3,489 | $142,616 | $32,000 | $110,616 |
| 2019 | $3,328 | $134,556 | $32,000 | $102,556 |
| 2018 | $3,418 | $138,012 | $30,000 | $108,012 |
| 2017 | $3,176 | $125,908 | $30,000 | $95,908 |
| 2016 | $3,027 | $118,868 | $30,000 | $88,868 |
| 2015 | $2,906 | $112,868 | $24,000 | $88,868 |
| 2014 | $2,487 | $99,388 | $0 | $0 |
Source: Public Records
Map
Nearby Homes
- 1440 Buckskin Trail
- 310 Burgess Mill Trail
- 1475 Rocky Shoals Ln
- 715 Moonlight Way
- 1025 Pebble Creek Trail
- 1275 Water View Ln
- 1040 Rockbass Rd
- 3990 Sweeting St
- 640 Rockbass Rd
- 3045 Salisbury Ln
- 1060 Water View Ln
- 410 Blackwood Ln
- 451 Nichols Dr
- 825 River Trace Ct
- 195 Woodcliff Ct
- 3320 Spencer St
- 1037 Windermere Crossing
- 1041 Windermere Crossing
- 3245 Sparling St
- 1660 Sugar Ridge Dr
- 1640 Sugar Ridge Dr
- 1670 Sugar Ridge Dr
- 1630 Sugar Ridge Dr
- 0 Sugar Ridge Dr Unit 8619003
- 0 Sugar Ridge Dr Unit 8072264
- 0 Sugar Ridge Dr Unit 8018749
- 0 Sugar Ridge Dr Unit 8013997
- 0 Sugar Ridge Dr Unit 7623142
- 0 Sugar Ridge Dr
- 1680 Sugar Ridge Dr
- 1645 Sugar Ridge Dr
- 1620 Sugar Ridge Dr
- 1665 Sugar Ridge Dr
- 1610 Pepperbush Ct
- 1690 Sugar Ridge Dr
- 1675 Sugar Ridge Dr
- 1610 Sugar Ridge Dr Unit 559
- 1610 Sugar Ridge Dr
- 1685 Sugar Ridge Dr