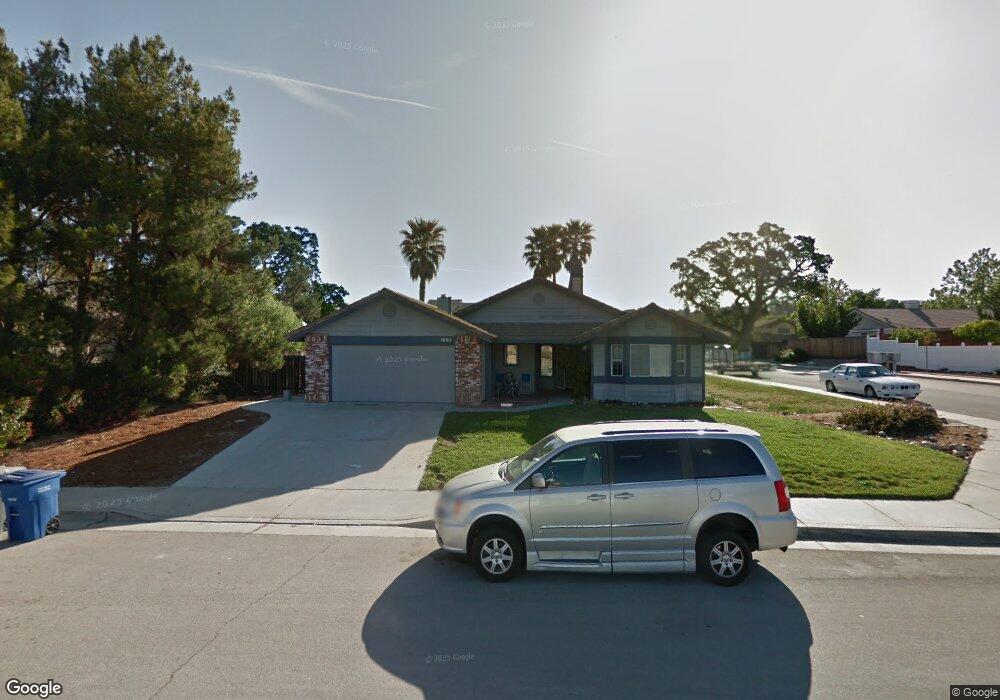
1650 Summer Creek Ln Paso Robles, CA 93446
Estimated Value: $698,000 - $787,132
3
Beds
2
Baths
1,400
Sq Ft
$541/Sq Ft
Est. Value
About This Home
This home is located at 1650 Summer Creek Ln, Paso Robles, CA 93446 and is currently estimated at $757,283, approximately $540 per square foot. 1650 Summer Creek Ln is a home located in San Luis Obispo County with nearby schools including Pat Butler Elementary School, George H. Flamson Middle School, and Paso Robles High School.
Ownership History
Date
Name
Owned For
Owner Type
Purchase Details
Closed on
Mar 20, 2020
Sold by
Holt Marcus and Holt Shakora
Bought by
Bank Of Stockton
Current Estimated Value
Purchase Details
Closed on
Nov 11, 2003
Sold by
Zarycka Maryanne Julie
Bought by
Holt Marcus and Williams Shakora
Purchase Details
Closed on
Oct 2, 2001
Sold by
Zarycka Maryanne Julie
Bought by
Zarycka Maryanne Julie
Home Financials for this Owner
Home Financials are based on the most recent Mortgage that was taken out on this home.
Original Mortgage
$221,000
Interest Rate
6.91%
Mortgage Type
Balloon
Purchase Details
Closed on
Feb 11, 1998
Sold by
Matteson Maryanne Julie and Zarycka Maryanne Julie
Bought by
Zarycka Maryanne Julie
Purchase Details
Closed on
Jan 21, 1997
Sold by
Matteson Steve
Bought by
Matteson Maryanne
Create a Home Valuation Report for This Property
The Home Valuation Report is an in-depth analysis detailing your home's value as well as a comparison with similar homes in the area
Home Values in the Area
Average Home Value in this Area
Purchase History
| Date | Buyer | Sale Price | Title Company |
|---|---|---|---|
| Bank Of Stockton | $129,000 | North American Title Co Inc | |
| Holt Marcus | $370,000 | Fidelity Title Company | |
| Zarycka Maryanne Julie | -- | Fidelity National Title Co | |
| Zarycka Maryanne Julie | -- | -- | |
| Matteson Maryanne | -- | -- |
Source: Public Records
Mortgage History
| Date | Status | Borrower | Loan Amount |
|---|---|---|---|
| Previous Owner | Zarycka Maryanne Julie | $221,000 |
Source: Public Records
Tax History Compared to Growth
Tax History
| Year | Tax Paid | Tax Assessment Tax Assessment Total Assessment is a certain percentage of the fair market value that is determined by local assessors to be the total taxable value of land and additions on the property. | Land | Improvement |
|---|---|---|---|---|
| 2025 | $5,788 | $526,046 | $227,478 | $298,568 |
| 2024 | $5,690 | $515,732 | $223,018 | $292,714 |
| 2023 | $5,690 | $505,621 | $218,646 | $286,975 |
| 2022 | $5,592 | $495,708 | $214,359 | $281,349 |
| 2021 | $6,085 | $538,389 | $210,156 | $328,233 |
| 2020 | $5,421 | $481,007 | $208,002 | $273,005 |
| 2019 | $5,341 | $471,576 | $203,924 | $267,652 |
| 2018 | $5,268 | $462,330 | $199,926 | $262,404 |
| 2017 | $4,760 | $435,000 | $240,000 | $195,000 |
| 2016 | $4,626 | $423,000 | $185,000 | $238,000 |
| 2015 | $4,348 | $393,000 | $170,000 | $223,000 |
| 2014 | $4,088 | $375,000 | $165,000 | $210,000 |
Source: Public Records
Map
Nearby Homes
- 1780 Sophia Way
- 311 Oak Hill Rd
- 0 Vine St
- 350 Robles Rd
- 789 Oxen St
- 123 Olive St
- 912 Wade Dr
- 915 Moran Ct
- 506 Navajo Ave
- 649 Olive St
- 919 Torrey Pines Dr
- 470 Nickerson Dr
- 1410 Fire Rock Loop
- 1185 Beaver Creek Ln
- 225 Pacific Ave
- 818 Olive St
- 594 Red Cloud Rd
- 1320 Fire Rock Loop
- 1375 Santa Ysabel Ave
- 308 Maplewood Ct
- 1648 Summer Creek Ln
- 175 Riverbank Ln
- 1704 Summer Creek Ln
- 1642 Summer Creek Ln
- 1705 Creeksand Ln
- 177 Riverbank Ln
- 1649 Summer Creek Ln
- 1647 Summer Creek Ln
- 1706 Summer Creek Ln
- 1640 Summer Creek Ln
- 1645 Summer Creek Ln
- 1707 Creeksand Ln
- 179 Riverbank Ln
- 1705 Summer Creek Ln
- 172 Edgewater Ln
- 1643 Summer Creek Ln
- 170 Edgewater Ln
- 1708 Summer Creek Ln
- 174 Edgewater Ln
- 1707 Summer Creek Ln