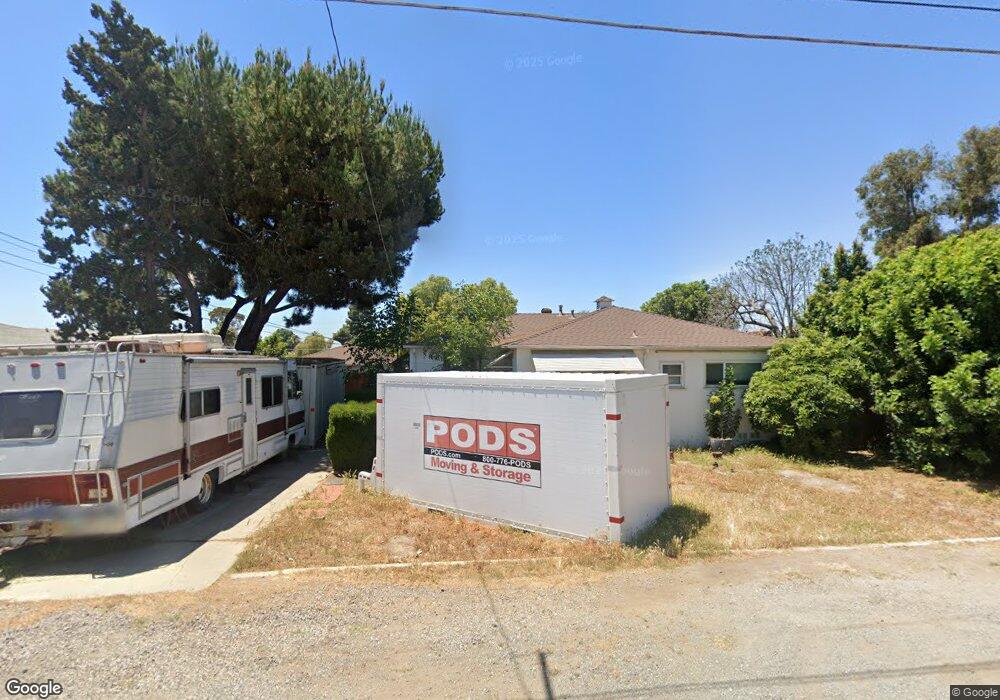
1650 Taft St Lemon Grove, CA 91945
Estimated Value: $729,346 - $863,000
3
Beds
2
Baths
1,263
Sq Ft
$612/Sq Ft
Est. Value
About This Home
This home is located at 1650 Taft St, Lemon Grove, CA 91945 and is currently estimated at $773,087, approximately $612 per square foot. 1650 Taft St is a home located in San Diego County with nearby schools including Monterey Heights Elementary, Mount Miguel High School, and Keiller Leadership Academy.
Ownership History
Date
Name
Owned For
Owner Type
Purchase Details
Closed on
Jun 5, 2013
Sold by
Clark Geoffrey A
Bought by
Clark Geoffrey A and Clark Lee
Current Estimated Value
Home Financials for this Owner
Home Financials are based on the most recent Mortgage that was taken out on this home.
Original Mortgage
$226,000
Outstanding Balance
$159,901
Interest Rate
3.37%
Mortgage Type
New Conventional
Estimated Equity
$613,186
Purchase Details
Closed on
Sep 1, 2000
Sold by
Taylor Susan Trust 01-24-92 and Taylor Susan
Bought by
Clark Geoffrey A
Home Financials for this Owner
Home Financials are based on the most recent Mortgage that was taken out on this home.
Original Mortgage
$155,011
Interest Rate
8.01%
Mortgage Type
FHA
Purchase Details
Closed on
Aug 4, 1989
Purchase Details
Closed on
Feb 26, 1986
Create a Home Valuation Report for This Property
The Home Valuation Report is an in-depth analysis detailing your home's value as well as a comparison with similar homes in the area
Home Values in the Area
Average Home Value in this Area
Purchase History
| Date | Buyer | Sale Price | Title Company |
|---|---|---|---|
| Clark Geoffrey A | -- | Ticor Title San Diego Branch | |
| Clark Geoffrey A | $189,500 | Guardian Title Company | |
| -- | $133,500 | -- | |
| -- | $95,000 | -- |
Source: Public Records
Mortgage History
| Date | Status | Borrower | Loan Amount |
|---|---|---|---|
| Open | Clark Geoffrey A | $226,000 | |
| Closed | Clark Geoffrey A | $155,011 |
Source: Public Records
Tax History Compared to Growth
Tax History
| Year | Tax Paid | Tax Assessment Tax Assessment Total Assessment is a certain percentage of the fair market value that is determined by local assessors to be the total taxable value of land and additions on the property. | Land | Improvement |
|---|---|---|---|---|
| 2025 | $3,972 | $285,522 | $111,200 | $174,322 |
| 2024 | $3,972 | $279,924 | $109,020 | $170,904 |
| 2023 | $3,876 | $274,436 | $106,883 | $167,553 |
| 2022 | $3,856 | $269,056 | $104,788 | $164,268 |
| 2021 | $3,806 | $263,782 | $102,734 | $161,048 |
| 2020 | $3,759 | $261,078 | $101,681 | $159,397 |
| 2019 | $3,696 | $255,960 | $99,688 | $156,272 |
| 2018 | $3,612 | $250,942 | $97,734 | $153,208 |
| 2017 | $3,555 | $246,022 | $95,818 | $150,204 |
| 2016 | $3,425 | $241,199 | $93,940 | $147,259 |
| 2015 | $3,405 | $237,577 | $92,529 | $145,048 |
| 2014 | $3,276 | $232,924 | $90,717 | $142,207 |
Source: Public Records
Map
Nearby Homes
- 1737-41 Glencoe Dr
- 1607 Watwood Rd
- 1701 Dayton Dr
- 1015 Harlan Cir
- 1795 Lemon Grove Ave
- 1928 Noble St
- 1062 Armacost Rd
- 2030 Fairhaven St
- 2108 El Prado Ave
- 1915 Englewood Dr
- 725 Peggy Dr
- 2240-42 El Prado Ave
- 7191 Dinovo St
- 1630 Cameron Dr
- 8046-48 Sarawak Dr
- 1942 Madera St
- 753 Jacumba St
- 1434 San Altos Place
- 863 Leppert St
- 2127 Berry St
- 1636 Taft St
- 1660 Taft St
- 1625 Woodrow Ave
- 1631 Woodrow Ave
- 1619 Woodrow Ave
- 1637 Woodrow Ave
- 1616 Taft St
- 1655 Taft St
- 1680 Taft St
- 1613 Woodrow Ave
- 1637 Taft St
- 1643 Woodrow Ave
- 1675 Taft St
- 1606 Taft St
- 1607 Woodrow Ave
- 7425 Canton Dr
- 1628 Woodrow Ave
- 1622 Woodrow Ave
- 1607 Taft St
- 1634 Woodrow Ave