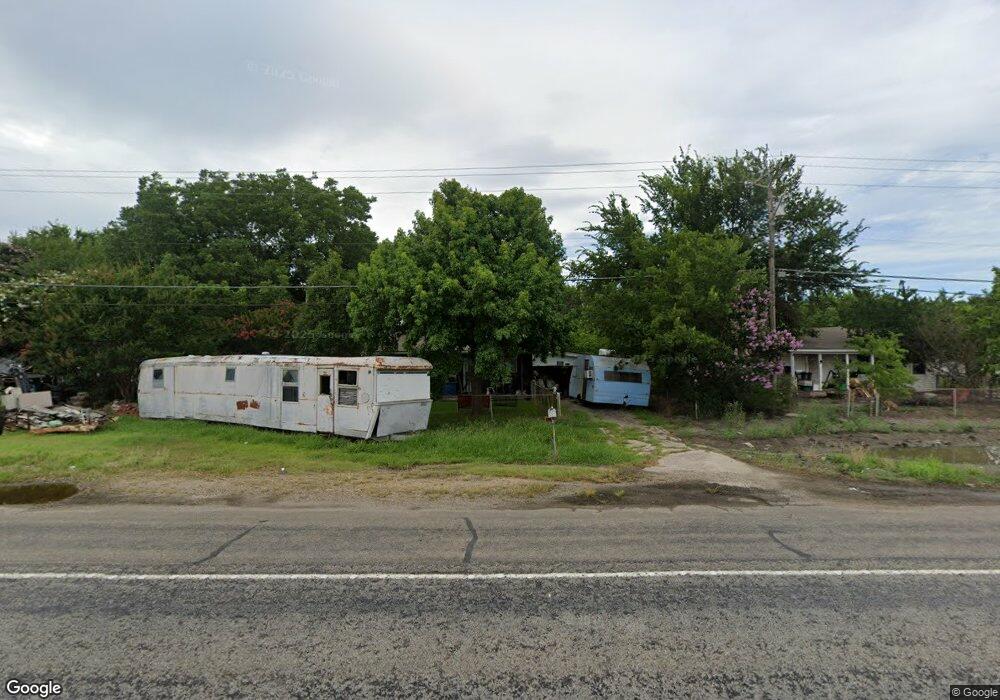
1650 W State Highway 56 Bonham, TX 75418
Estimated Value: $76,000 - $188,000
4
Beds
1
Bath
800
Sq Ft
$158/Sq Ft
Est. Value
About This Home
This home is located at 1650 W State Highway 56, Bonham, TX 75418 and is currently estimated at $126,030, approximately $157 per square foot. 1650 W State Highway 56 is a home located in Fannin County with nearby schools including Finley-Oates Elementary School and LH Rather Jr High School.
Ownership History
Date
Name
Owned For
Owner Type
Purchase Details
Closed on
Dec 12, 2023
Sold by
Bonne Opportunities Llc
Bought by
Pragopa Investments Llc
Current Estimated Value
Purchase Details
Closed on
Apr 5, 2023
Sold by
Apfsdemm Inc
Bought by
Mih Ventures Llc
Purchase Details
Closed on
Oct 28, 2014
Sold by
Pettit Jarrod
Bought by
Apfsdemm Inc
Purchase Details
Closed on
May 6, 2014
Sold by
Taylor J D and Taylor Yvonne Jane
Bought by
Citimortgage Inc
Purchase Details
Closed on
Mar 9, 2009
Sold by
Johnson Gregory Scott and Baker Tammy Jo
Bought by
Taylor J D and Taylor Yvonne Jane
Home Financials for this Owner
Home Financials are based on the most recent Mortgage that was taken out on this home.
Original Mortgage
$31,919
Interest Rate
5.13%
Mortgage Type
VA
Create a Home Valuation Report for This Property
The Home Valuation Report is an in-depth analysis detailing your home's value as well as a comparison with similar homes in the area
Home Values in the Area
Average Home Value in this Area
Purchase History
| Date | Buyer | Sale Price | Title Company |
|---|---|---|---|
| Pragopa Investments Llc | -- | None Listed On Document | |
| Bonne Opportunities Llc | -- | None Listed On Document | |
| Mih Ventures Llc | -- | None Listed On Document | |
| Apfsdemm Inc | -- | None Available | |
| Citimortgage Inc | $10,206 | None Available | |
| Taylor J D | $31,919 | None Available |
Source: Public Records
Mortgage History
| Date | Status | Borrower | Loan Amount |
|---|---|---|---|
| Previous Owner | Taylor J D | $31,919 |
Source: Public Records
Tax History Compared to Growth
Tax History
| Year | Tax Paid | Tax Assessment Tax Assessment Total Assessment is a certain percentage of the fair market value that is determined by local assessors to be the total taxable value of land and additions on the property. | Land | Improvement |
|---|---|---|---|---|
| 2025 | $742 | $42,400 | $14,800 | $27,600 |
| 2024 | $742 | $53,410 | $14,800 | $38,610 |
| 2023 | $685 | $48,498 | $10,660 | $37,838 |
| 2022 | $791 | $48,498 | $10,660 | $37,838 |
| 2021 | $607 | $32,422 | $4,563 | $27,859 |
| 2020 | $669 | $35,210 | $3,970 | $31,240 |
| 2019 | $612 | $31,050 | $2,550 | $28,500 |
| 2018 | $587 | $29,850 | $2,550 | $27,300 |
| 2017 | $551 | $29,200 | $2,180 | $27,020 |
| 2016 | $546 | $28,930 | $2,070 | $26,860 |
| 2015 | -- | $28,300 | $2,160 | $26,140 |
| 2014 | -- | $29,830 | $1,670 | $28,160 |
Source: Public Records
Map
Nearby Homes
- 849 County Road 4130
- 1107 S State Highway 121
- TBD County Road 4200
- 2039 County Road 4130
- 2039 Co Rd 4130
- 1309 S 4th St
- 1304 S 5th St
- TBD Fm 68
- TBD Route 121
- TBD County Road 1540
- 1115 S 6th St
- 000 LOT 3 Smith St
- 000 LOT 1 Smith St
- 000 LOT 2 Smith St
- 000 LOT 4 Smith St
- 911 S 4th St
- 812 S 6th St
- 803 S 6th St
- 911 W 8th St
- 905 W 7th St
- 1686 W State Highway 56
- 1640 W State Highway 56
- 1686 Texas 56
- 1612 W State Highway 56
- 1612 W Hwy 56
- 1736 W State Highway 56
- 1588 W State Highway 56
- 2226 Texas 56
- 1488 W State Highway 56
- 1488 W State Highway 56
- 264 County Road 4130
- 232 County Road 4130
- 300 County Road 4130
- 1292 W State Highway 56
- 1413 W State Highway 56
- 1413 Texas 56
- TBD County Road 4130
- 402 County Road 4130
- 1470 W State Highway 56
- 2039 W State Highway 56