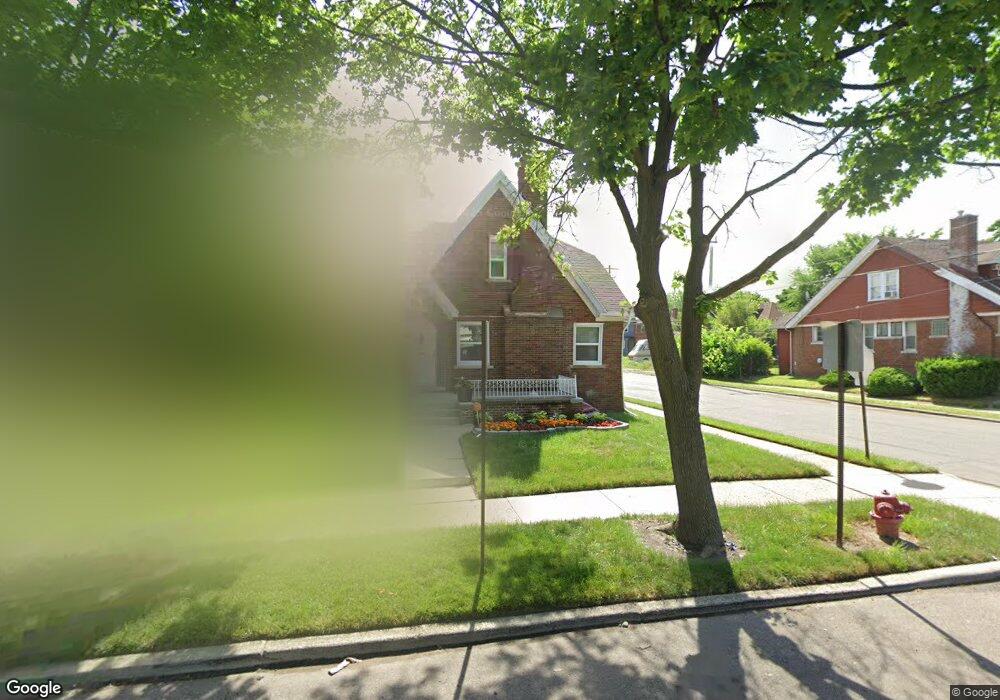
16502 Muirland St Unit Bldg-Unit Detroit, MI 48221
Martin Park NeighborhoodEstimated Value: $219,301 - $311,000
--
Bed
2
Baths
1,581
Sq Ft
$166/Sq Ft
Est. Value
About This Home
This home is located at 16502 Muirland St Unit Bldg-Unit, Detroit, MI 48221 and is currently estimated at $263,075, approximately $166 per square foot. 16502 Muirland St Unit Bldg-Unit is a home located in Wayne County with nearby schools including Paul Robeson Malcolm X Academy, Charles L. Spain Elementary-Middle School, and Edward 'Duke' Ellington Conservatory of Music and Art.
Ownership History
Date
Name
Owned For
Owner Type
Purchase Details
Closed on
Jan 28, 2020
Sold by
Visionary Homes Llc
Bought by
Malone Joyceson L
Current Estimated Value
Purchase Details
Closed on
Aug 26, 2019
Sold by
Travis Ted L and Stroud Sharon
Bought by
Visionary Homes Llc
Purchase Details
Closed on
Mar 14, 2017
Sold by
Brandelle Investments Llc
Bought by
Travis Ted L
Purchase Details
Closed on
Dec 7, 2015
Sold by
Smart Homes Investments Ltd
Bought by
Brandelle Investments Llc
Purchase Details
Closed on
Dec 13, 2013
Sold by
Wayne County Treasurer
Bought by
Smart Homes Investments Ltd
Purchase Details
Closed on
Oct 20, 2004
Sold by
Sharp Rosalyn
Bought by
Sharp Rosalyn
Purchase Details
Closed on
Jun 7, 2000
Sold by
Ford Lashawn R
Bought by
Rosalyn Sharp
Purchase Details
Closed on
Dec 15, 1999
Sold by
Ford Lashawn R
Bought by
Mortgage Ltd
Create a Home Valuation Report for This Property
The Home Valuation Report is an in-depth analysis detailing your home's value as well as a comparison with similar homes in the area
Home Values in the Area
Average Home Value in this Area
Purchase History
| Date | Buyer | Sale Price | Title Company |
|---|---|---|---|
| Malone Joyceson L | -- | Visionary Title Agency Llc | |
| Visionary Homes Llc | $61,000 | Etitle Agency Inc | |
| Travis Ted L | $36,000 | Abstract Title Agency | |
| Brandelle Investments Llc | $32,000 | Attorney | |
| Smart Homes Investments Ltd | $2,300 | None Available | |
| Sharp Rosalyn | -- | Able Title Agency Llc | |
| Rosalyn Sharp | -- | -- | |
| Mortgage Ltd | $15,100 | -- |
Source: Public Records
Tax History Compared to Growth
Tax History
| Year | Tax Paid | Tax Assessment Tax Assessment Total Assessment is a certain percentage of the fair market value that is determined by local assessors to be the total taxable value of land and additions on the property. | Land | Improvement |
|---|---|---|---|---|
| 2025 | $1,711 | $53,500 | $0 | $0 |
| 2024 | $1,711 | $44,700 | $0 | $0 |
| 2023 | $1,660 | $35,100 | $0 | $0 |
| 2022 | $1,828 | $28,600 | $0 | $0 |
| 2021 | $1,779 | $21,900 | $0 | $0 |
| 2020 | $1,904 | $18,800 | $0 | $0 |
| 2019 | $1,318 | $13,700 | $0 | $0 |
| 2018 | $1,156 | $11,900 | $0 | $0 |
| 2017 | $182 | $12,000 | $0 | $0 |
| 2016 | $1,085 | $23,900 | $0 | $0 |
| 2015 | $1,120 | $11,200 | $0 | $0 |
| 2013 | $1,794 | $17,936 | $0 | $0 |
| 2010 | -- | $24,895 | $804 | $24,091 |
Source: Public Records
Map
Nearby Homes
- 16239 Muirland St
- 16554 Muirland St
- 16211 Muirland St
- 16533 Parkside St
- 16182 Fairfield St
- 16167 Muirland St
- 16532 Parkside St
- 16126 Dexter Ave
- 16631 Lawton St
- 16834 Muirland St
- 16200 Lawton St
- 16651 Lawton St
- 15904 Muirland St
- 16831 Lawton St
- 16133 Princeton St
- 16182 Princeton St
- 7126 Puritan Ave
- 7147 Puritan Ave
- 7419 Puritan Ave
- 16936 Fairfield St
- 16502 Muirland St
- 16510 Muirland St
- 16501 Wildemere St
- 16258 Muirland St
- 16518 Muirland St
- 16526 Muirland St
- 16252 Muirland St
- 16509 Wildemere St
- 16532 Muirland St
- 16535 Wildemere St
- 16246 Muirland St
- 16515 Wildemere St
- 16261 Wildemere St Unit Bldg-Unit
- 16503 Muirland St
- 16527 Wildemere St
- 16247 Wildemere St
- 16255 Wildemere St
- 16540 Muirland St
- 16240 Muirland St
- 16261 Muirland St