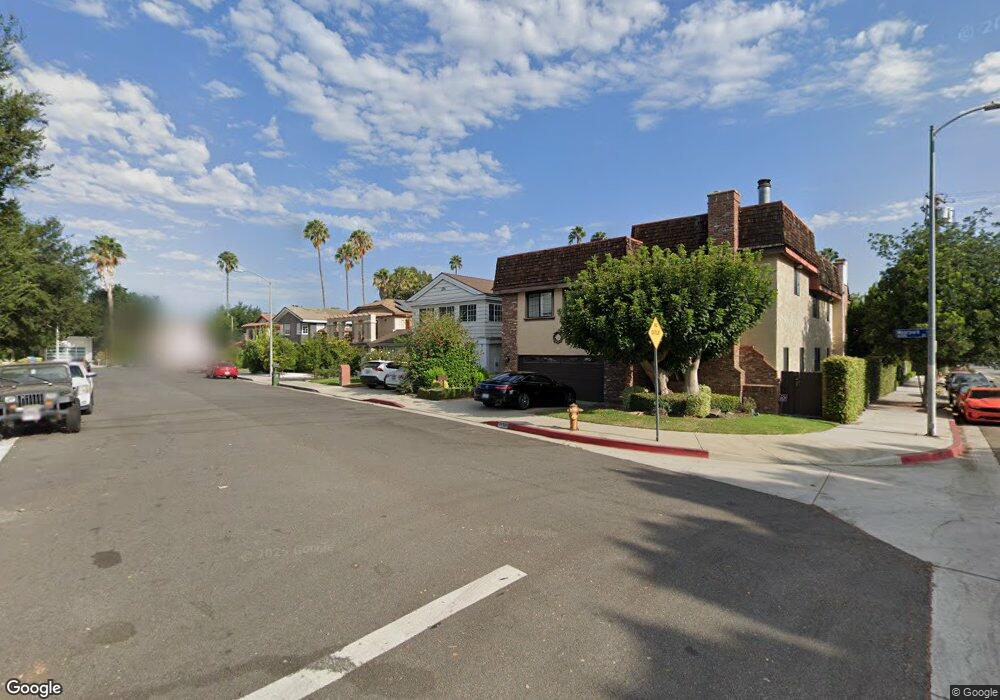
16509 Moorpark St Encino, CA 91436
Estimated Value: $1,921,000 - $3,143,000
5
Beds
6
Baths
4,078
Sq Ft
$579/Sq Ft
Est. Value
About This Home
This home is located at 16509 Moorpark St, Encino, CA 91436 and is currently estimated at $2,362,128, approximately $579 per square foot. 16509 Moorpark St is a home located in Los Angeles County with nearby schools including Gaspar De Portola Middle School, Encino Charter Elementary, and Hesby Oaks Elementary School.
Ownership History
Date
Name
Owned For
Owner Type
Purchase Details
Closed on
Oct 28, 2013
Sold by
Danyan Jack
Bought by
Danyan Jack and The Jack Danyan Revocable Living Trust
Current Estimated Value
Purchase Details
Closed on
May 3, 1996
Sold by
Security Pacific National Trust Company
Bought by
Danyan Jack
Home Financials for this Owner
Home Financials are based on the most recent Mortgage that was taken out on this home.
Original Mortgage
$207,000
Interest Rate
8.07%
Mortgage Type
Balloon
Purchase Details
Closed on
Jun 22, 1995
Sold by
Ostfeld David and Ostfeld Zipora
Bought by
Security Pacific National Trust Company
Purchase Details
Closed on
Apr 16, 1995
Sold by
Michaelov Avi
Bought by
Michaelov Sigal
Purchase Details
Closed on
Feb 16, 1995
Sold by
Lavy Nissim
Bought by
Michaelov Avi
Purchase Details
Closed on
Sep 11, 1994
Sold by
Klain Iris
Bought by
Cohen Moshe
Purchase Details
Closed on
May 13, 1994
Sold by
Ostfeld David
Bought by
Klain Iris
Create a Home Valuation Report for This Property
The Home Valuation Report is an in-depth analysis detailing your home's value as well as a comparison with similar homes in the area
Home Values in the Area
Average Home Value in this Area
Purchase History
| Date | Buyer | Sale Price | Title Company |
|---|---|---|---|
| Danyan Jack | -- | None Available | |
| Danyan Jack | $300,500 | Fidelity Title | |
| Security Pacific National Trust Company | $365,000 | Stewart Title | |
| Michaelov Sigal | -- | -- | |
| Michaelov Avi | -- | -- | |
| Cohen Moshe | -- | -- | |
| Klain Iris | -- | -- | |
| Lavy Nissim | -- | -- |
Source: Public Records
Mortgage History
| Date | Status | Borrower | Loan Amount |
|---|---|---|---|
| Closed | Danyan Jack | $207,000 |
Source: Public Records
Tax History Compared to Growth
Tax History
| Year | Tax Paid | Tax Assessment Tax Assessment Total Assessment is a certain percentage of the fair market value that is determined by local assessors to be the total taxable value of land and additions on the property. | Land | Improvement |
|---|---|---|---|---|
| 2025 | $6,868 | $547,430 | $149,501 | $397,929 |
| 2024 | $6,868 | $536,697 | $146,570 | $390,127 |
| 2023 | $6,740 | $526,175 | $143,697 | $382,478 |
| 2022 | $6,435 | $515,859 | $140,880 | $374,979 |
| 2021 | $6,335 | $505,745 | $138,118 | $367,627 |
| 2019 | $5,602 | $447,499 | $134,022 | $313,477 |
| 2018 | $5,503 | $438,726 | $131,395 | $307,331 |
| 2016 | $5,224 | $421,692 | $126,294 | $295,398 |
| 2015 | $5,149 | $415,358 | $124,397 | $290,961 |
| 2014 | $5,170 | $407,223 | $121,961 | $285,262 |
Source: Public Records
Map
Nearby Homes
- 5012 Gerald Ave
- 4981 Noeline Ave
- 5016 Rubio Ave
- 4953 Edgerton Ave
- 5000 Petit Ave
- 4939 Petit Ave
- 16723 La Maida St
- 16728 Morrison St
- 4620 Rubio Ave
- 16643 Addison St
- 16206 Morrison St
- 4591 De Celis Place
- 16749 Addison St
- 4830 Valjean Ave
- 16762 Otsego St
- 4632 Libbit Ave
- 4752 Park Encino Ln Unit 212
- 4728 Park Encino Ln Unit 318
- 16846 Addison St
- 16828 Otsego St
- 16513 Moorpark St
- 16501 Moorpark St
- 16519 Moorpark St
- 16525 Moorpark St
- 16512 Moorpark St
- 16508 Moorpark St
- 16500 Moorpark St
- 16518 Moorpark St
- 16524 Moorpark St
- 4929 Hayvenhurst Ave
- 4908 Hayvenhurst Ave
- 16528 Moorpark St
- 4927 Hayvenhurst Ave
- 4914 Hayvenhurst Ave
- 4849 Hayvenhurst Ave
- 4851 Hayvenhurst Ave Unit 1
- 4847 Hayvenhurst Ave
- 4845 Hayvenhurst Ave
- 4860 Hayvenhurst Ave