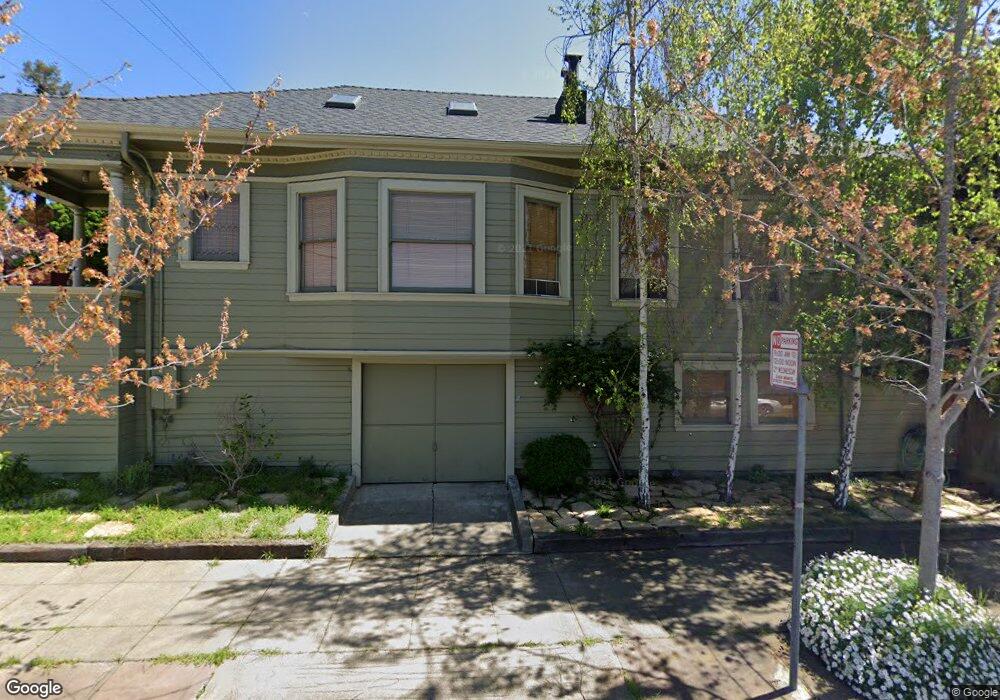
1651 Excelsior Ave Oakland, CA 94602
Glenview NeighborhoodEstimated Value: $678,000 - $989,000
2
Beds
2
Baths
1,257
Sq Ft
$684/Sq Ft
Est. Value
About This Home
This home is located at 1651 Excelsior Ave, Oakland, CA 94602 and is currently estimated at $860,369, approximately $684 per square foot. 1651 Excelsior Ave is a home located in Alameda County with nearby schools including Glenview Elementary School, Edna Brewer Middle School, and Oakland High School.
Ownership History
Date
Name
Owned For
Owner Type
Purchase Details
Closed on
Aug 5, 2003
Sold by
Cook Michelle L
Bought by
Cook Alfred
Current Estimated Value
Home Financials for this Owner
Home Financials are based on the most recent Mortgage that was taken out on this home.
Original Mortgage
$340,000
Outstanding Balance
$138,783
Interest Rate
4.62%
Mortgage Type
Purchase Money Mortgage
Estimated Equity
$721,586
Purchase Details
Closed on
Dec 13, 1999
Sold by
Wright Christopher and Wright Zenen
Bought by
Cook Alfred and Cook Michelle L
Home Financials for this Owner
Home Financials are based on the most recent Mortgage that was taken out on this home.
Original Mortgage
$223,200
Interest Rate
7.82%
Mortgage Type
Stand Alone First
Purchase Details
Closed on
Dec 5, 1996
Sold by
Birkie Margret
Bought by
Wright Christopher and Wright Zenen
Home Financials for this Owner
Home Financials are based on the most recent Mortgage that was taken out on this home.
Original Mortgage
$141,550
Interest Rate
7.67%
Create a Home Valuation Report for This Property
The Home Valuation Report is an in-depth analysis detailing your home's value as well as a comparison with similar homes in the area
Home Values in the Area
Average Home Value in this Area
Purchase History
| Date | Buyer | Sale Price | Title Company |
|---|---|---|---|
| Cook Alfred | -- | Alliance Title Company | |
| Cook Alfred | $279,000 | North American Title Co | |
| Wright Christopher | $149,000 | First American Title Guarant |
Source: Public Records
Mortgage History
| Date | Status | Borrower | Loan Amount |
|---|---|---|---|
| Open | Cook Alfred | $340,000 | |
| Closed | Cook Alfred | $223,200 | |
| Previous Owner | Wright Christopher | $141,550 | |
| Closed | Cook Alfred | $13,950 |
Source: Public Records
Tax History Compared to Growth
Tax History
| Year | Tax Paid | Tax Assessment Tax Assessment Total Assessment is a certain percentage of the fair market value that is determined by local assessors to be the total taxable value of land and additions on the property. | Land | Improvement |
|---|---|---|---|---|
| 2025 | $7,958 | $421,791 | $128,637 | $300,154 |
| 2024 | $7,958 | $413,385 | $126,115 | $294,270 |
| 2023 | $8,530 | $412,144 | $123,643 | $288,501 |
| 2022 | $8,274 | $397,064 | $121,219 | $282,845 |
| 2021 | $8,000 | $389,143 | $118,843 | $277,300 |
| 2020 | $7,904 | $392,083 | $117,625 | $274,458 |
| 2019 | $7,379 | $384,397 | $115,319 | $269,078 |
| 2018 | $7,213 | $376,861 | $113,058 | $263,803 |
| 2017 | $6,745 | $369,473 | $110,842 | $258,631 |
| 2016 | $6,357 | $362,230 | $108,669 | $253,561 |
| 2015 | $6,375 | $356,790 | $107,037 | $249,753 |
| 2014 | $6,436 | $349,801 | $104,940 | $244,861 |
Source: Public Records
Map
Nearby Homes
- 1621 E 38th St
- 1701 Macarthur Blvd
- 1703 Macarthur Blvd
- 1777 Sausal St
- 3541 Dimond Ave
- 1515 Hampel St
- 3186 Mckillop Rd
- 3945 Randolph Ave Unit 2
- 2106 Woodbine Ave
- 1600 E 31st St
- 2550 Pleasant St
- 1235 Hampel St
- 1233 Hampel St
- 2240 Macarthur Blvd
- 1458 E 33rd St
- 3123 Beaumont Ave
- 1930 E 30th St
- 2133 E 30th St
- 3464 Champion St
- 2628 School St
- 1657 Excelsior Ave
- 3614 Woodruff Ave
- 1661 Excelsior Ave
- 3606 Woodruff Ave
- 3600 Woodruff Ave
- 1664 Miami Ct
- 1627 Excelsior Ave
- 1673 Excelsior Ave
- 3615 Woodruff Ave
- 1670 Miami Ct
- 3607 Woodruff Ave
- 3701 Woodruff Ave
- 1621 Excelsior Ave
- 1676 Miami Ct
- 1677 Excelsior Ave
- 3526 Woodruff Ave
- 3601 Woodruff Ave
- 1666 Excelsior Ave
- 3707 Woodruff Ave
- 1680 Miami Ct