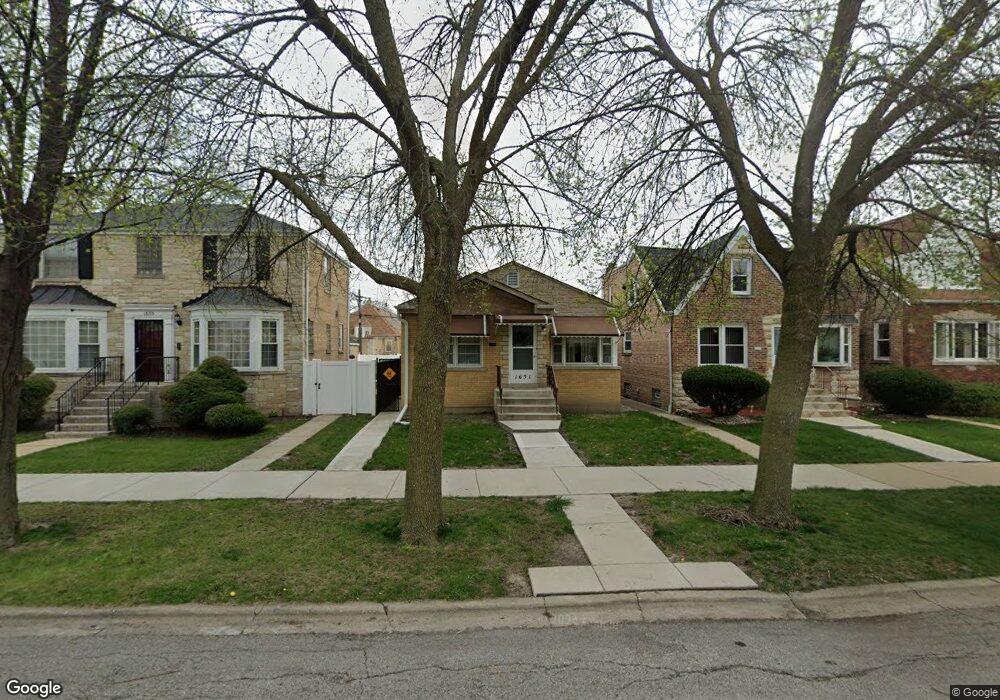
1651 N Rutherford Ave Chicago, IL 60707
Galewood NeighborhoodEstimated Value: $291,000 - $375,000
2
Beds
1
Bath
1,040
Sq Ft
$318/Sq Ft
Est. Value
About This Home
This home is located at 1651 N Rutherford Ave, Chicago, IL 60707 and is currently estimated at $330,498, approximately $317 per square foot. 1651 N Rutherford Ave is a home located in Cook County with nearby schools including Sayre Elementary Language Academy, Steinmetz College Prep, and Acero - Roberto Clemente Elementary School.
Ownership History
Date
Name
Owned For
Owner Type
Purchase Details
Closed on
Nov 30, 1998
Sold by
Barr Chris and Barr Denise C
Bought by
Stpierre Lily M
Current Estimated Value
Home Financials for this Owner
Home Financials are based on the most recent Mortgage that was taken out on this home.
Original Mortgage
$132,900
Outstanding Balance
$19,055
Interest Rate
6.93%
Mortgage Type
FHA
Estimated Equity
$311,443
Purchase Details
Closed on
Jan 5, 1998
Sold by
Carver Barr Denise
Bought by
Barr Chris and Carver Barr Denise
Home Financials for this Owner
Home Financials are based on the most recent Mortgage that was taken out on this home.
Original Mortgage
$116,500
Interest Rate
7.28%
Mortgage Type
Balloon
Purchase Details
Closed on
Jul 6, 1995
Sold by
American National Bk & Tr Co Of Chicago
Bought by
Carver Barr Denise
Home Financials for this Owner
Home Financials are based on the most recent Mortgage that was taken out on this home.
Original Mortgage
$97,600
Interest Rate
7.79%
Create a Home Valuation Report for This Property
The Home Valuation Report is an in-depth analysis detailing your home's value as well as a comparison with similar homes in the area
Home Values in the Area
Average Home Value in this Area
Purchase History
| Date | Buyer | Sale Price | Title Company |
|---|---|---|---|
| Stpierre Lily M | $137,000 | Professional National Title | |
| Barr Chris | -- | Ticor Title Insurance | |
| Carver Barr Denise | $122,000 | -- |
Source: Public Records
Mortgage History
| Date | Status | Borrower | Loan Amount |
|---|---|---|---|
| Open | Stpierre Lily M | $132,900 | |
| Previous Owner | Barr Chris | $116,500 | |
| Previous Owner | Carver Barr Denise | $97,600 |
Source: Public Records
Tax History
| Year | Tax Paid | Tax Assessment Tax Assessment Total Assessment is a certain percentage of the fair market value that is determined by local assessors to be the total taxable value of land and additions on the property. | Land | Improvement |
|---|---|---|---|---|
| 2025 | $3,385 | $29,000 | $11,718 | $17,282 |
| 2024 | $3,385 | $29,000 | $11,718 | $17,282 |
| 2023 | $3,261 | $22,000 | $9,450 | $12,550 |
| 2022 | $3,261 | $22,000 | $9,450 | $12,550 |
| 2021 | $3,220 | $22,000 | $9,450 | $12,550 |
| 2020 | $2,593 | $17,218 | $4,725 | $12,493 |
| 2019 | $2,648 | $19,347 | $4,725 | $14,622 |
| 2018 | $2,982 | $21,271 | $4,725 | $16,546 |
| 2017 | $3,483 | $22,245 | $4,158 | $18,087 |
| 2016 | $3,600 | $22,245 | $4,158 | $18,087 |
| 2015 | $3,598 | $22,245 | $4,158 | $18,087 |
| 2014 | $3,702 | $22,505 | $3,780 | $18,725 |
| 2013 | $3,618 | $22,505 | $3,780 | $18,725 |
Source: Public Records
Map
Nearby Homes
- 1625 N Oak Park Ave
- 1816 N Nashville Ave
- 1220 N Euclid Ave
- 1220 N Oak Park Ave
- 1215 Linden Ave
- 1631 N Natchez Ave
- 1836 N New England Ave
- 1701 N Sayre Ave
- 1747 N Sayre Ave
- 1701 N Nagle Ave
- 1043 N Grove Ave
- 1812 N Nordica Ave
- 1111 Woodbine Ave
- 1822 N Mulligan Ave
- 1017 N Grove Ave
- 943 N Oak Park Ave
- 7139 W Cortland St
- 921 Fair Oaks Ave
- 222 Le Moyne Pkwy
- 2204 N Natchez Ave Unit 1N
- 1649 N Rutherford Ave
- 1655 N Rutherford Ave
- 1645 N Rutherford Ave
- 1643 N Rutherford Ave
- 1639 N Rutherford Ave
- 1652 N Normandy Ave
- 1648 N Normandy Ave
- 1656 N Normandy Ave
- 1637 N Rutherford Ave
- 1644 N Normandy Ave
- 1701 N Rutherford Ave
- 1642 N Normandy Ave
- 1633 N Rutherford Ave
- 1638 N Normandy Ave
- 1652 N Rutherford Ave
- 1648 N Rutherford Ave
- 1656 N Rutherford Ave
- 1644 N Rutherford Ave
- 1705 N Rutherford Ave
- 1700 N Normandy Ave
Your Personal Tour Guide
Ask me questions while you tour the home.