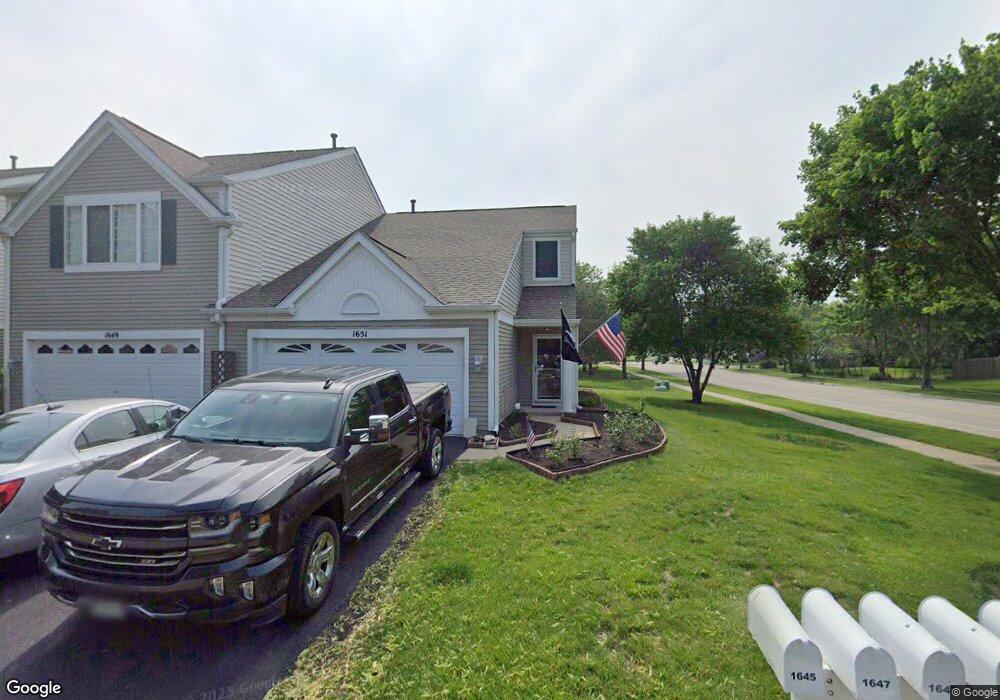
1651 Spaulding Rd Unit 544 Bartlett, IL 60103
Estimated Value: $217,940 - $325,000
2
Beds
--
Bath
1,300
Sq Ft
$214/Sq Ft
Est. Value
About This Home
This home is located at 1651 Spaulding Rd Unit 544, Bartlett, IL 60103 and is currently estimated at $277,985, approximately $213 per square foot. 1651 Spaulding Rd Unit 544 is a home located in Cook County with nearby schools including Liberty Elementary School, Kenyon Woods Middle School, and South Elgin High School.
Ownership History
Date
Name
Owned For
Owner Type
Purchase Details
Closed on
Jun 26, 1998
Sold by
Crackel Brian D and Crackel Laurie A
Bought by
Ringa Francis R and Gaida Davida
Current Estimated Value
Home Financials for this Owner
Home Financials are based on the most recent Mortgage that was taken out on this home.
Original Mortgage
$125,460
Outstanding Balance
$22,972
Interest Rate
7.03%
Mortgage Type
VA
Estimated Equity
$255,013
Purchase Details
Closed on
Jun 21, 1996
Sold by
Pulte Home Corp
Bought by
Crackel Brian D and Crackel Laurie A
Home Financials for this Owner
Home Financials are based on the most recent Mortgage that was taken out on this home.
Original Mortgage
$116,250
Interest Rate
8.31%
Mortgage Type
FHA
Create a Home Valuation Report for This Property
The Home Valuation Report is an in-depth analysis detailing your home's value as well as a comparison with similar homes in the area
Home Values in the Area
Average Home Value in this Area
Purchase History
| Date | Buyer | Sale Price | Title Company |
|---|---|---|---|
| Ringa Francis R | $123,000 | -- | |
| Crackel Brian D | $122,500 | Intercounty Title |
Source: Public Records
Mortgage History
| Date | Status | Borrower | Loan Amount |
|---|---|---|---|
| Open | Ringa Francis R | $125,460 | |
| Previous Owner | Crackel Brian D | $116,250 |
Source: Public Records
Tax History
| Year | Tax Paid | Tax Assessment Tax Assessment Total Assessment is a certain percentage of the fair market value that is determined by local assessors to be the total taxable value of land and additions on the property. | Land | Improvement |
|---|---|---|---|---|
| 2025 | $3,539 | $24,347 | $8,679 | $15,668 |
| 2024 | $3,539 | $17,148 | $7,377 | $9,771 |
| 2023 | $3,362 | $17,148 | $7,377 | $9,771 |
| 2022 | $3,362 | $17,148 | $7,377 | $9,771 |
| 2021 | $2,445 | $12,574 | $6,509 | $6,065 |
| 2020 | $2,563 | $12,574 | $6,509 | $6,065 |
| 2019 | $2,568 | $14,006 | $6,509 | $7,497 |
| 2018 | $2,570 | $13,373 | $5,641 | $7,732 |
| 2017 | $4,700 | $13,373 | $5,641 | $7,732 |
| 2016 | $2,984 | $13,373 | $5,641 | $7,732 |
| 2015 | $3,149 | $11,501 | $4,990 | $6,511 |
| 2014 | $3,128 | $11,501 | $4,990 | $6,511 |
| 2013 | $2,987 | $11,501 | $4,990 | $6,511 |
Source: Public Records
Map
Nearby Homes
- 1627 Spaulding Rd Unit 524
- 529 Rose Ln
- 610 Golfers Ln
- 106 8th Ave
- 1316 Foxglove Dr
- 1314 Foxglove Dr
- 1810 Golf View Dr
- 1261 Foxglove Dr
- 1328 Foxglove Dr
- 1326 Foxglove Dr
- 1324 Foxglove Dr
- 127 5th Ave
- 1285 Foxglove Dr
- 1283 Foxglove Dr
- 1376 Foxglove Dr
- 1374 Foxglove Dr
- 1372 Foxglove Dr
- 1368 Foxglove Dr
- 1330 Foxglove Dr
- 1332 Foxglove Dr
- 1649 Spaulding Rd Unit 543
- 1647 Spaulding Rd
- 1645 Spaulding Rd
- 1663 Spaulding Rd Unit 552
- 1621 Spaulding Rd Unit 521
- 1623 Spaulding Rd Unit 522
- 1643 Spaulding Rd Unit 534
- 1665 Spaulding Rd Unit 553
- 1667 Spaulding Rd Unit 554
- 1625 Spaulding Rd Unit 523
- 1641 Spaulding Rd Unit 533
- 1660 Scarlet Ct
- 1669 Spaulding Rd Unit 555
- 1629 Spaulding Rd Unit 525
- 1631 Spaulding Rd Unit 526
- 1671 Spaulding Rd Unit 556
- 1639 Spaulding Rd Unit 532
- 461 Topaz Ln
- 1633 Spaulding Rd
Your Personal Tour Guide
Ask me questions while you tour the home.