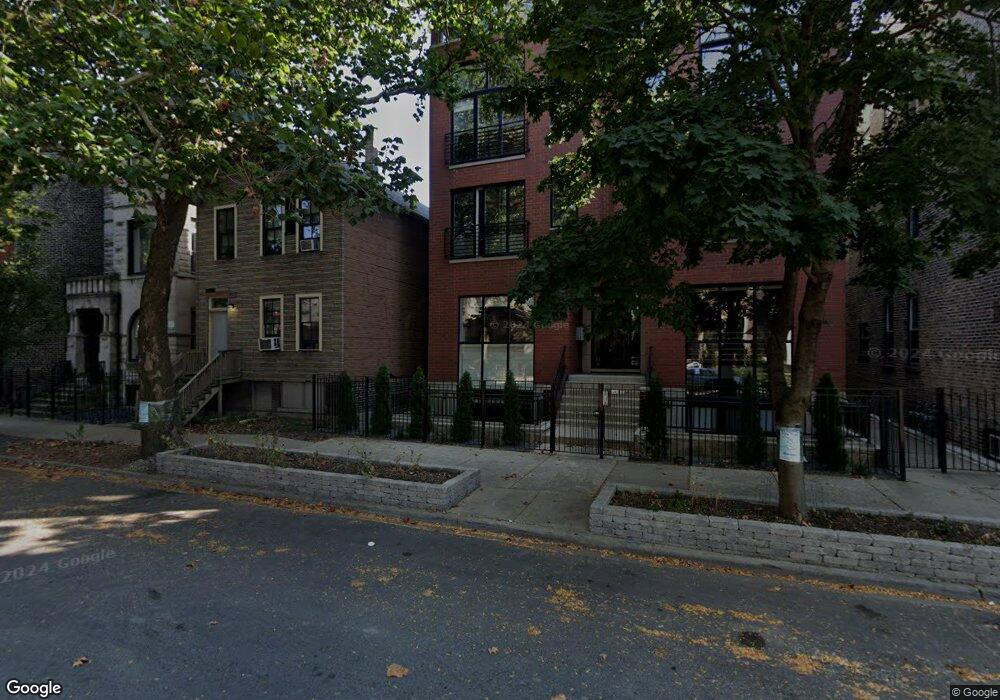
1651 W Huron St Unit 3E Chicago, IL 60622
West Town NeighborhoodEstimated Value: $645,000 - $687,483
3
Beds
3
Baths
1,995
Sq Ft
$338/Sq Ft
Est. Value
About This Home
This home is located at 1651 W Huron St Unit 3E, Chicago, IL 60622 and is currently estimated at $673,621, approximately $337 per square foot. 1651 W Huron St Unit 3E is a home located in Cook County with nearby schools including Talcott Elementary School, Wells Community Academy High School, and Golder College Prep.
Ownership History
Date
Name
Owned For
Owner Type
Purchase Details
Closed on
May 19, 2009
Sold by
Hoff Cyndy
Bought by
Hanson Thomas
Current Estimated Value
Home Financials for this Owner
Home Financials are based on the most recent Mortgage that was taken out on this home.
Original Mortgage
$382,500
Outstanding Balance
$243,618
Interest Rate
5%
Mortgage Type
Unknown
Estimated Equity
$430,003
Purchase Details
Closed on
Nov 26, 2001
Sold by
Kapudija Romeo
Bought by
Hanson Thomas and Hoff Cyndy
Purchase Details
Closed on
Feb 2, 2001
Sold by
1651 & 53 West Huron Street Llc
Bought by
Kapudija Romeo
Home Financials for this Owner
Home Financials are based on the most recent Mortgage that was taken out on this home.
Original Mortgage
$318,750
Interest Rate
8%
Mortgage Type
Adjustable Rate Mortgage/ARM
Create a Home Valuation Report for This Property
The Home Valuation Report is an in-depth analysis detailing your home's value as well as a comparison with similar homes in the area
Home Values in the Area
Average Home Value in this Area
Purchase History
| Date | Buyer | Sale Price | Title Company |
|---|---|---|---|
| Hanson Thomas | -- | None Available | |
| Hanson Thomas | $415,000 | -- | |
| Kapudija Romeo | -- | -- |
Source: Public Records
Mortgage History
| Date | Status | Borrower | Loan Amount |
|---|---|---|---|
| Open | Hanson Thomas | $382,500 | |
| Previous Owner | Kapudija Romeo | $318,750 |
Source: Public Records
Tax History Compared to Growth
Tax History
| Year | Tax Paid | Tax Assessment Tax Assessment Total Assessment is a certain percentage of the fair market value that is determined by local assessors to be the total taxable value of land and additions on the property. | Land | Improvement |
|---|---|---|---|---|
| 2024 | $10,453 | $60,941 | $9,418 | $51,523 |
| 2023 | $10,138 | $52,713 | $4,298 | $48,415 |
| 2022 | $10,138 | $52,713 | $4,298 | $48,415 |
| 2021 | $9,930 | $52,712 | $4,298 | $48,414 |
| 2020 | $10,890 | $51,988 | $4,298 | $47,690 |
| 2019 | $10,814 | $57,252 | $4,298 | $52,954 |
| 2018 | $10,631 | $57,252 | $4,298 | $52,954 |
| 2017 | $10,686 | $53,014 | $3,792 | $49,222 |
| 2016 | $10,118 | $53,014 | $3,792 | $49,222 |
| 2015 | $9,234 | $53,014 | $3,792 | $49,222 |
| 2014 | $6,724 | $38,808 | $3,223 | $35,585 |
| 2013 | $6,580 | $38,808 | $3,223 | $35,585 |
Source: Public Records
Map
Nearby Homes
- 1653 W Huron St Unit 2W
- 700 N Ashland Ave
- 1640 W Ohio St Unit 1R
- 1530 W Ohio St
- 1707 W Chicago Ave
- 1535 W Ohio St Unit 2
- 1514 W Superior St
- 1507 W Erie St
- 530 N Ashland Ave
- 1708 W Chicago Ave Unit 3
- 524 N Ashland Ave
- 524 N Ashland Ave Unit Garage
- 815 N Marshfield Ave Unit 301
- 1513 W Ohio St Unit 2W
- 529 N Hartland Ct
- 1610 W Grand Ave Unit 2C
- 504 N Paulina St
- 1811 W Superior St
- 814 N Hermitage Ave
- 1819 W Erie St
- 1651 W Huron St Unit 16512
- 1651 W Huron St Unit 16513
- 1651 W Huron St Unit 16511
- 1651 W Huron St Unit 2
- 1651 W Huron St Unit 2E
- 1653 W Huron St Unit 16532
- 1653 W Huron St Unit 16531
- 1653 W Huron St Unit 16533
- 1653 W Huron St Unit 3W
- 1649 W Huron St
- 1647 W Huron St Unit 1
- 1647 W Huron St
- 1647 W Huron St Unit 2
- 1647 W Huron St Unit 3
- 1647 W Huron St
- 1657 W Huron St Unit 2
- 1657 W Huron St Unit 1
- 1657 W Huron St Unit 3
- 651 N Paulina St Unit 2S
- 651 N Paulina St Unit 2N