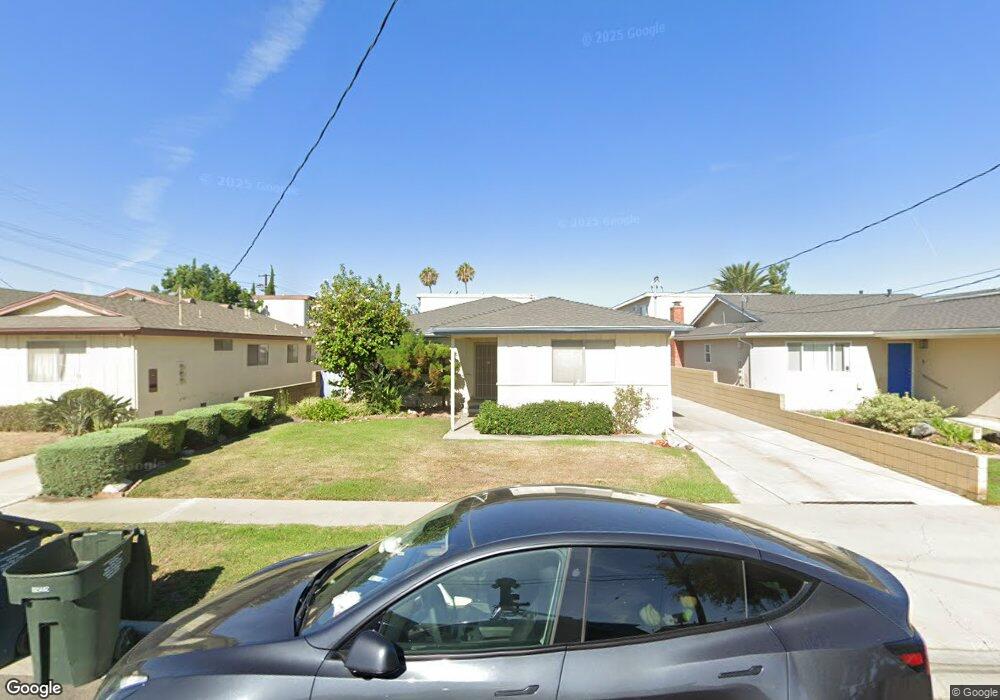
16511 S Saint Andrews Place Unit A Gardena, CA 90247
Estimated Value: $1,323,000 - $1,608,000
7
Beds
4
Baths
3,220
Sq Ft
$454/Sq Ft
Est. Value
About This Home
This home is located at 16511 S Saint Andrews Place Unit A, Gardena, CA 90247 and is currently estimated at $1,461,333, approximately $453 per square foot. 16511 S Saint Andrews Place Unit A is a home located in Los Angeles County with nearby schools including Denker Avenue Elementary School, Robert E. Peary Middle School, and Gardena Senior High School.
Ownership History
Date
Name
Owned For
Owner Type
Purchase Details
Closed on
Nov 28, 2017
Sold by
Wang Chi
Bought by
Lin Noah and Chi Wang Family Trust
Current Estimated Value
Purchase Details
Closed on
Sep 25, 2003
Sold by
Lin Cheng Kurn and Wang Chi
Bought by
Wang Chi
Home Financials for this Owner
Home Financials are based on the most recent Mortgage that was taken out on this home.
Original Mortgage
$230,000
Interest Rate
5%
Mortgage Type
Purchase Money Mortgage
Purchase Details
Closed on
Jun 28, 2002
Sold by
Wang Yi S
Bought by
Wang Yi S and Lin Cheng Kurn
Purchase Details
Closed on
Apr 22, 2002
Sold by
Wang Y S and Lin Cheng Kurn
Bought by
Wang Yi S
Home Financials for this Owner
Home Financials are based on the most recent Mortgage that was taken out on this home.
Original Mortgage
$210,000
Interest Rate
7.08%
Create a Home Valuation Report for This Property
The Home Valuation Report is an in-depth analysis detailing your home's value as well as a comparison with similar homes in the area
Home Values in the Area
Average Home Value in this Area
Purchase History
| Date | Buyer | Sale Price | Title Company |
|---|---|---|---|
| Lin Noah | -- | None Available | |
| Wang Chi | -- | Chicago Title Co | |
| Wang Killian Kuei | -- | Chicago Title Co | |
| Wang Yi S | -- | -- | |
| Wang Yi S | -- | Landsafe Title |
Source: Public Records
Mortgage History
| Date | Status | Borrower | Loan Amount |
|---|---|---|---|
| Closed | Wang Killian Kuei | $230,000 | |
| Closed | Wang Yi S | $210,000 |
Source: Public Records
Tax History Compared to Growth
Tax History
| Year | Tax Paid | Tax Assessment Tax Assessment Total Assessment is a certain percentage of the fair market value that is determined by local assessors to be the total taxable value of land and additions on the property. | Land | Improvement |
|---|---|---|---|---|
| 2025 | $8,281 | $645,085 | $223,344 | $421,741 |
| 2024 | $8,281 | $632,437 | $218,965 | $413,472 |
| 2023 | $8,135 | $620,037 | $214,672 | $405,365 |
| 2022 | $7,742 | $607,880 | $210,463 | $397,417 |
| 2021 | $7,654 | $595,962 | $206,337 | $389,625 |
| 2019 | $7,410 | $578,287 | $200,218 | $378,069 |
| 2018 | $7,211 | $566,949 | $196,293 | $370,656 |
| 2017 | $7,144 | $555,834 | $192,445 | $363,389 |
| 2016 | $6,953 | $544,936 | $188,672 | $356,264 |
| 2015 | $6,839 | $536,751 | $185,838 | $350,913 |
| 2014 | $6,845 | $526,238 | $182,198 | $344,040 |
Source: Public Records
Map
Nearby Homes
- 2044 166th St
- 16949 S Western Ave Unit 29B
- 16949 S Western Ave
- 16949 S Western Ave Unit 34
- 314 Bridgewater Way Unit 2
- 320 Bridgewater Way Unit 7
- 15908 S Manhattan Place
- 15906 S Manhattan Place
- 17024 S Western Ave Unit 28
- 17024 S Western Ave Unit 36
- 2072 Redondo Beach Blvd
- 16008 La Salle Ave Unit 11
- 16720 S Dalton Ave
- 2003 Artesia Blvd Unit 104
- 2025 Artesia Blvd Unit G
- 2015 W 157th St
- 16938 S Dalton Ave
- 17039 S Dalton Ave
- 1900 Artesia Blvd Unit 4
- 1900 Artesia Blvd Unit 63
- 16511 S Saint Andrews Place Unit B
- 16511 S Saint Andrews Place Unit C
- 16511 S Saint Andrews Place
- 16507 S Saint Andrews Place
- 16515 S Saint Andrews Place Unit B
- 16515 S Saint Andrews Place
- 16503 S Saint Andrews Place
- 1901 W 166th St
- 16431 S Saint Andrews Place Unit E
- 16431 S Saint Andrews Place
- 16431 S Saint Andrews Place Unit C
- 16431 S Saint Andrews Place Unit B & C
- 16431 S Saint Andrews Place Unit A
- 16512 Gramercy Place
- 16508 Gramercy Place
- 16520 Gramercy Place
- 16504 Gramercy Place
- 16427 S Saint Andrews Place
- 16432 Gramercy Place
- 16508 S Saint Andrews Place