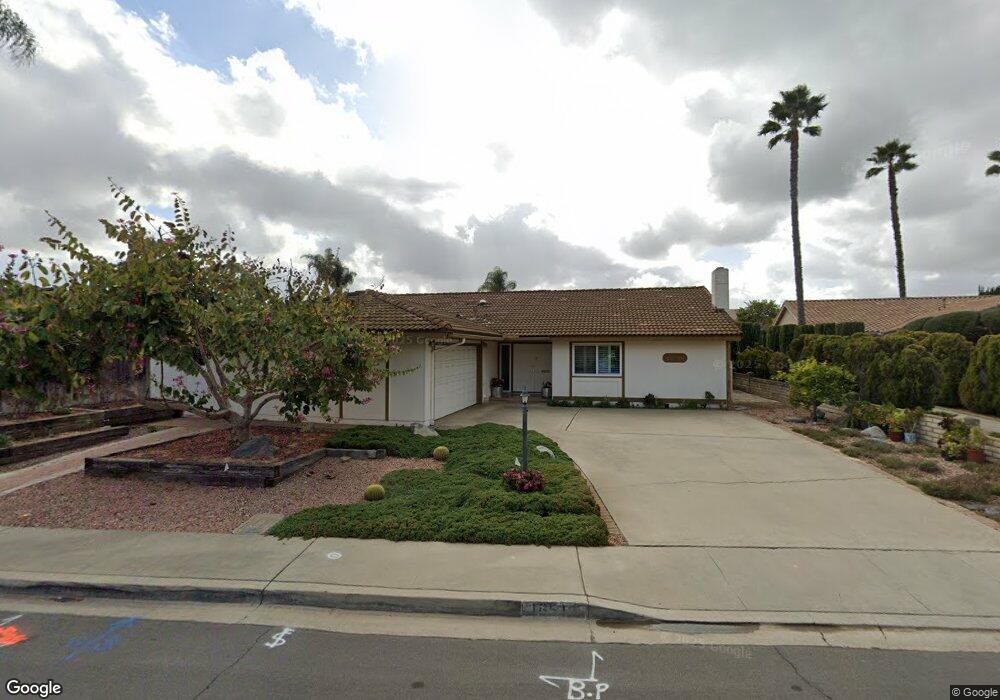
16516 Gabarda Rd San Diego, CA 92128
Rancho Bernardo NeighborhoodEstimated Value: $979,928 - $1,161,000
3
Beds
2
Baths
1,614
Sq Ft
$652/Sq Ft
Est. Value
About This Home
This home is located at 16516 Gabarda Rd, San Diego, CA 92128 and is currently estimated at $1,052,732, approximately $652 per square foot. 16516 Gabarda Rd is a home located in San Diego County with nearby schools including Highland Ranch Elementary School, Bernardo Heights Middle, and Rancho Bernardo High.
Ownership History
Date
Name
Owned For
Owner Type
Purchase Details
Closed on
Mar 3, 2023
Sold by
Massab John P and Massab Anna Linda
Bought by
Corder Family Trust
Current Estimated Value
Purchase Details
Closed on
Jun 27, 2016
Sold by
Massab John and Massab Anna
Bought by
Jam Family Trust and Massab Anna L
Purchase Details
Closed on
May 10, 2015
Sold by
Brown Michael D
Bought by
Massab John P and Massab Anna Linda
Purchase Details
Closed on
Jan 19, 2005
Sold by
Pierson Larry
Bought by
Pierson Larry J
Home Financials for this Owner
Home Financials are based on the most recent Mortgage that was taken out on this home.
Original Mortgage
$300,000
Interest Rate
5%
Mortgage Type
Purchase Money Mortgage
Purchase Details
Closed on
Nov 22, 2004
Sold by
Baur John C
Bought by
Pierson Larry
Home Financials for this Owner
Home Financials are based on the most recent Mortgage that was taken out on this home.
Original Mortgage
$300,000
Interest Rate
5%
Mortgage Type
Purchase Money Mortgage
Create a Home Valuation Report for This Property
The Home Valuation Report is an in-depth analysis detailing your home's value as well as a comparison with similar homes in the area
Home Values in the Area
Average Home Value in this Area
Purchase History
| Date | Buyer | Sale Price | Title Company |
|---|---|---|---|
| Corder Family Trust | $885,000 | Lawyers Title Company | |
| Jam Family Trust | -- | None Available | |
| Massab John P | $539,000 | Ticor Title Co San Diego | |
| Pierson Larry J | -- | -- | |
| Pierson Larry | $430,000 | Ticor Title San Diego |
Source: Public Records
Mortgage History
| Date | Status | Borrower | Loan Amount |
|---|---|---|---|
| Previous Owner | Pierson Larry | $300,000 |
Source: Public Records
Tax History Compared to Growth
Tax History
| Year | Tax Paid | Tax Assessment Tax Assessment Total Assessment is a certain percentage of the fair market value that is determined by local assessors to be the total taxable value of land and additions on the property. | Land | Improvement |
|---|---|---|---|---|
| 2025 | $10,217 | $920,752 | $427,066 | $493,686 |
| 2024 | $10,217 | $902,699 | $418,693 | $484,006 |
| 2023 | $6,947 | $601,261 | $278,879 | $322,382 |
| 2022 | $6,832 | $601,261 | $278,879 | $322,382 |
| 2021 | $6,743 | $589,472 | $273,411 | $316,061 |
| 2020 | $6,653 | $583,429 | $270,608 | $312,821 |
| 2019 | $6,480 | $571,990 | $265,302 | $306,688 |
| 2018 | $6,298 | $560,775 | $260,100 | $300,675 |
| 2017 | $6,131 | $549,780 | $255,000 | $294,780 |
| 2016 | $6,005 | $539,000 | $250,000 | $289,000 |
| 2015 | $2,593 | $237,099 | $107,145 | $129,954 |
| 2014 | $2,532 | $232,456 | $105,047 | $127,409 |
Source: Public Records
Map
Nearby Homes
- 16556 Gabarda Rd
- 16498 Roca Dr
- 16566 Caminito Vecinos Unit 31
- 16555 Caminito Vecinos Unit 39
- 16599 Caminito Vecinos Unit 5
- 12712 Caminito Cancion Unit 121
- 12753 Caminito Cancion Unit 129
- 16422 Roca Dr
- 16413 Roca Dr
- 16632 Roca Dr Unit 41
- 16660 Roca Dr
- 12450 Meandro Rd
- 16515 Felice Dr
- 12494 Senda Rd
- 12365 Horado Rd
- 12486 Lomica Dr
- 12821 Avenida la Valencia
- 16849 Palmero Dr Unit 2
- 16421 Ramada Dr
- 16934 Manresa Ct
- 16516 Gabarda Rd
- 16526 Gabarda Rd
- 12592 Horado Rd
- 12578 Horado Rd
- 16536 Gabarda Rd
- 12566 Horado Rd
- 16519 Gabarda Rd
- 16527 Gabarda Rd
- 16546 Gabarda Rd
- 16511 Gabarda Rd
- 16539 Sambroso Place
- 16527 Sambroso Place
- 16551 Sambroso Place
- 16535 Gabarda Rd
- 16515 Sambroso Place
- 16551 Gabarda Rd
- 16503 Gabarda Rd
- 12593 Horado Rd
- 12581 Horado Rd
- 16563 Sambroso Place