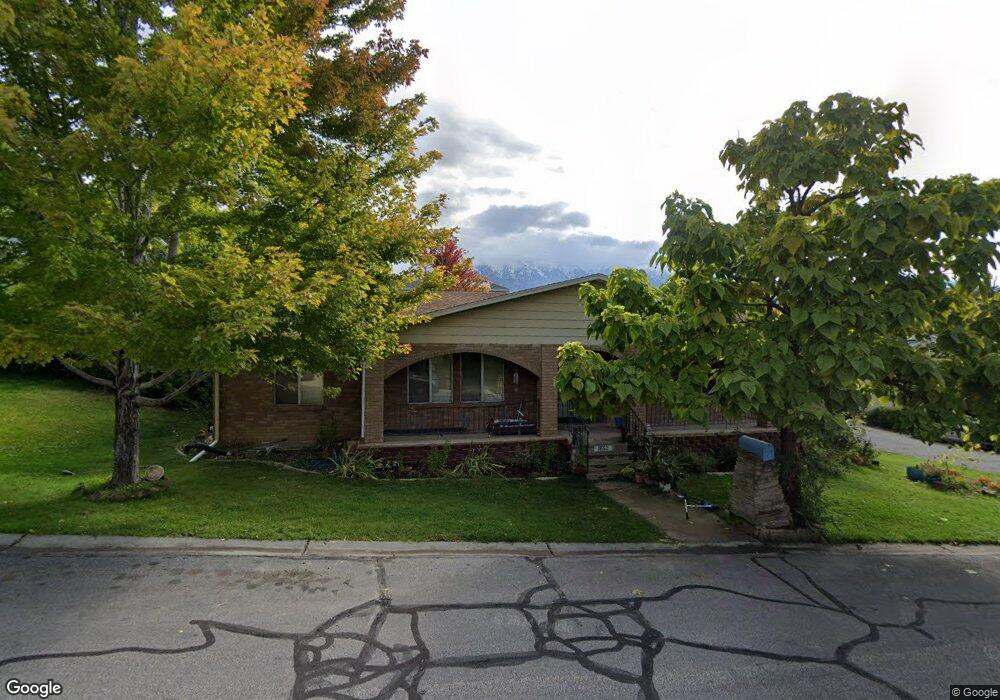
1652 N Quail Rd Orem, UT 84097
Northridge NeighborhoodEstimated Value: $676,000 - $754,047
4
Beds
2
Baths
3,948
Sq Ft
$179/Sq Ft
Est. Value
About This Home
This home is located at 1652 N Quail Rd, Orem, UT 84097 and is currently estimated at $708,016, approximately $179 per square foot. 1652 N Quail Rd is a home located in Utah County with nearby schools including Orchard Elementary School, Oak Canyon Junior High School, and Timpanogos High School.
Ownership History
Date
Name
Owned For
Owner Type
Purchase Details
Closed on
Nov 16, 2018
Sold by
Saganstone Flippers Llc
Bought by
Stanfill Michael and Stanfill Vanessa
Current Estimated Value
Home Financials for this Owner
Home Financials are based on the most recent Mortgage that was taken out on this home.
Original Mortgage
$302,000
Outstanding Balance
$262,880
Interest Rate
4.7%
Mortgage Type
New Conventional
Estimated Equity
$445,136
Purchase Details
Closed on
Jan 27, 2017
Sold by
Teeples Frank G and Teeples Donna G
Bought by
Teeples Edward E
Home Financials for this Owner
Home Financials are based on the most recent Mortgage that was taken out on this home.
Original Mortgage
$76,000
Interest Rate
3.9%
Mortgage Type
Purchase Money Mortgage
Purchase Details
Closed on
Oct 26, 2004
Sold by
Nielson Harvey G and Nielson Jacqueline A
Bought by
Teeples Frank G and Teeples Donna G
Create a Home Valuation Report for This Property
The Home Valuation Report is an in-depth analysis detailing your home's value as well as a comparison with similar homes in the area
Home Values in the Area
Average Home Value in this Area
Purchase History
| Date | Buyer | Sale Price | Title Company |
|---|---|---|---|
| Stanfill Michael | -- | Highland Title | |
| Teeples Edward E | -- | None Available | |
| Saganstone Flippers Llc | -- | Highland Title | |
| Teeples Frank G | -- | First American Title Co |
Source: Public Records
Mortgage History
| Date | Status | Borrower | Loan Amount |
|---|---|---|---|
| Open | Stanfill Michael | $302,000 | |
| Previous Owner | Saganstone Flippers Llc | $76,000 |
Source: Public Records
Tax History
| Year | Tax Paid | Tax Assessment Tax Assessment Total Assessment is a certain percentage of the fair market value that is determined by local assessors to be the total taxable value of land and additions on the property. | Land | Improvement |
|---|---|---|---|---|
| 2025 | $2,794 | $376,420 | -- | -- |
| 2024 | $2,794 | $341,605 | $0 | $0 |
| 2023 | $2,677 | $351,835 | $0 | $0 |
| 2022 | $2,724 | $346,775 | $0 | $0 |
| 2021 | $2,467 | $475,800 | $178,900 | $296,900 |
| 2020 | $2,313 | $438,400 | $155,600 | $282,800 |
| 2019 | $1,982 | $390,600 | $144,700 | $245,900 |
| 2018 | $1,937 | $364,700 | $144,700 | $220,000 |
| 2017 | $1,773 | $178,860 | $0 | $0 |
| 2016 | $1,839 | $171,050 | $0 | $0 |
| 2015 | $1,799 | $158,235 | $0 | $0 |
| 2014 | $1,748 | $153,065 | $0 | $0 |
Source: Public Records
Map
Nearby Homes
- 540 E Quail Rd
- 1480 N 430 E
- 695 E 1870 N
- 1643 N Mountain Oaks Dr
- 723 E 1450 N Unit 25
- 1636 N 160 E
- 363 E 1395 N Unit 22
- 1638 N 160 E
- 713 E 1500 St N Unit 19
- 1371 N 330 E Unit 8
- 110 S 1320 E
- 713 E 1450 N Unit 23
- 747 E 1500 N Unit 13
- 1366 N 750 E
- 733 E 1450 N Unit 5
- 1356 N 750 E Unit 11
- 1324 N 750 E Unit 3
- 710 E 1280 N
- 372 E 1165 N
- 49 W 1880 N
Your Personal Tour Guide
Ask me questions while you tour the home.