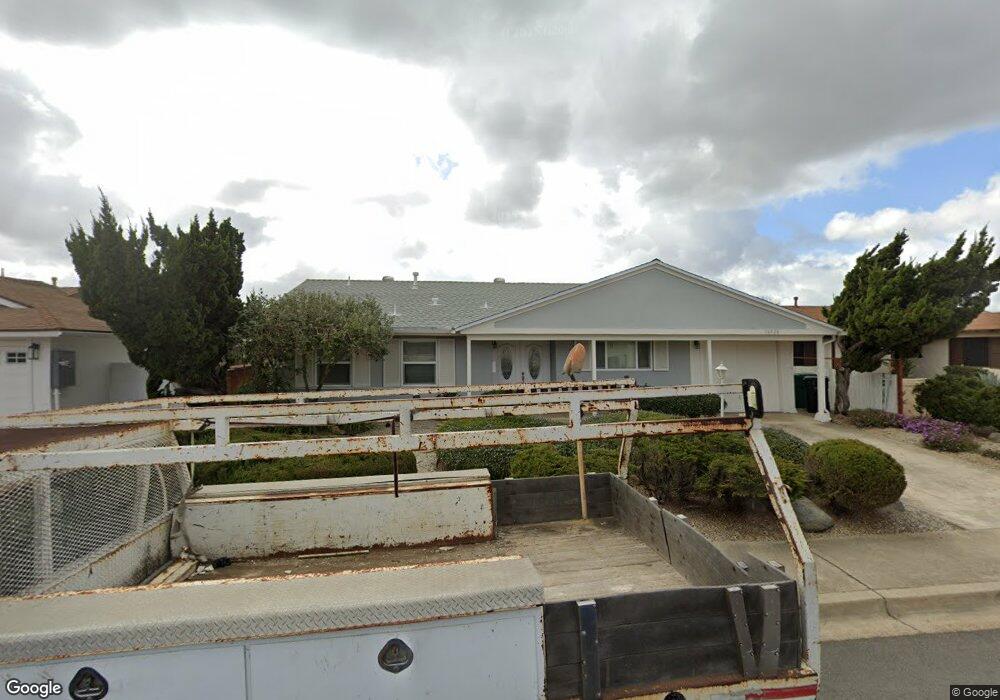
16526 Sambroso Place San Diego, CA 92128
Rancho Bernardo NeighborhoodEstimated Value: $768,000 - $821,000
2
Beds
2
Baths
1,197
Sq Ft
$660/Sq Ft
Est. Value
About This Home
This home is located at 16526 Sambroso Place, San Diego, CA 92128 and is currently estimated at $790,573, approximately $660 per square foot. 16526 Sambroso Place is a home located in San Diego County with nearby schools including Highland Ranch Elementary School, Bernardo Heights Middle, and Rancho Bernardo High.
Ownership History
Date
Name
Owned For
Owner Type
Purchase Details
Closed on
Dec 12, 2013
Sold by
Cline Edward M and Cline Stephanie E
Bought by
Cline Edward M and Cline Stephanie E
Current Estimated Value
Purchase Details
Closed on
Feb 6, 2009
Sold by
Lorenz Marguerite C
Bought by
Cline Edward M and Cline Stephanie E
Home Financials for this Owner
Home Financials are based on the most recent Mortgage that was taken out on this home.
Original Mortgage
$161,250
Outstanding Balance
$102,419
Interest Rate
5.19%
Mortgage Type
Purchase Money Mortgage
Estimated Equity
$688,154
Purchase Details
Closed on
Jan 5, 2000
Sold by
Briney Catherine C
Bought by
Briney Catherine C
Purchase Details
Closed on
Jan 4, 1995
Sold by
Haft Jannine Hudson and Haft Md Stanley S
Bought by
Briney Catherine C
Purchase Details
Closed on
Oct 5, 1989
Create a Home Valuation Report for This Property
The Home Valuation Report is an in-depth analysis detailing your home's value as well as a comparison with similar homes in the area
Home Values in the Area
Average Home Value in this Area
Purchase History
| Date | Buyer | Sale Price | Title Company |
|---|---|---|---|
| Cline Edward M | -- | None Available | |
| Cline Edward M | $215,000 | Western Resources Title | |
| Briney Catherine C | -- | -- | |
| Briney Catherine C | $119,000 | First American Title Co | |
| -- | $137,500 | -- |
Source: Public Records
Mortgage History
| Date | Status | Borrower | Loan Amount |
|---|---|---|---|
| Open | Cline Edward M | $161,250 |
Source: Public Records
Tax History Compared to Growth
Tax History
| Year | Tax Paid | Tax Assessment Tax Assessment Total Assessment is a certain percentage of the fair market value that is determined by local assessors to be the total taxable value of land and additions on the property. | Land | Improvement |
|---|---|---|---|---|
| 2025 | $3,254 | $289,762 | $193,156 | $96,606 |
| 2024 | $3,254 | $284,081 | $189,369 | $94,712 |
| 2023 | $3,185 | $278,511 | $185,656 | $92,855 |
| 2022 | $3,132 | $273,051 | $182,016 | $91,035 |
| 2021 | $3,092 | $267,698 | $178,448 | $89,250 |
| 2020 | $3,051 | $264,954 | $176,619 | $88,335 |
| 2019 | $2,973 | $259,759 | $173,156 | $86,603 |
| 2018 | $2,890 | $254,666 | $169,761 | $84,905 |
| 2017 | $2,813 | $249,674 | $166,433 | $83,241 |
| 2016 | $2,755 | $244,779 | $163,170 | $81,609 |
| 2015 | $2,715 | $241,104 | $160,720 | $80,384 |
| 2014 | $2,652 | $236,382 | $157,572 | $78,810 |
Source: Public Records
Map
Nearby Homes
- 16556 Gabarda Rd
- 16498 Roca Dr
- 16566 Caminito Vecinos Unit 31
- 16555 Caminito Vecinos Unit 39
- 16599 Caminito Vecinos Unit 5
- 16632 Roca Dr Unit 41
- 16422 Roca Dr
- 16413 Roca Dr
- 16660 Roca Dr
- 12712 Caminito Cancion Unit 121
- 12753 Caminito Cancion Unit 129
- 16515 Felice Dr
- 12450 Meandro Rd
- 12494 Senda Rd
- 12365 Horado Rd
- 12486 Lomica Dr
- 16421 Ramada Dr
- 12821 Avenida la Valencia
- 16849 Palmero Dr Unit 2
- 12249 Horado Rd
- 16538 Sambroso Place
- 16514 Sambroso Place
- 16523 Roca Dr
- 16511 Roca Dr
- 16535 Roca Dr
- 16550 Sambroso Place
- 16527 Sambroso Place
- 16515 Sambroso Place
- 16539 Sambroso Place
- 16545 Roca Dr
- 16495 Roca Dr
- 16551 Sambroso Place
- 12519 Horado Rd
- 16562 Sambroso Place Unit 5
- 16555 Roca Dr
- 12503 Horado Rd
- 12535 Horado Rd
- 12566 Horado Rd
- 16591 Felice Dr
- 16572 Sambroso Place