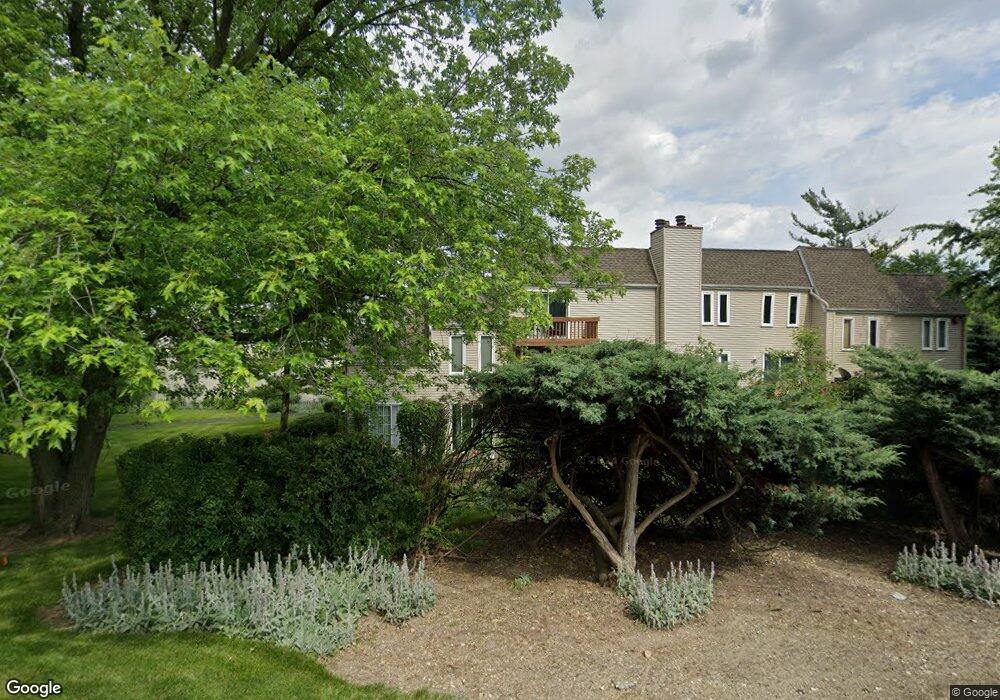
1653 Cove Ct Unit 3 Naperville, IL 60565
Meadow Glens NeighborhoodEstimated Value: $293,873 - $320,000
3
Beds
3
Baths
1,328
Sq Ft
$232/Sq Ft
Est. Value
About This Home
This home is located at 1653 Cove Ct Unit 3, Naperville, IL 60565 and is currently estimated at $307,718, approximately $231 per square foot. 1653 Cove Ct Unit 3 is a home located in DuPage County with nearby schools including Maplebrook Elementary School, Lincoln Jr. High School, and Naperville Central High School.
Ownership History
Date
Name
Owned For
Owner Type
Purchase Details
Closed on
Aug 18, 2006
Sold by
Malec Karine
Bought by
Patton Regina A
Current Estimated Value
Home Financials for this Owner
Home Financials are based on the most recent Mortgage that was taken out on this home.
Original Mortgage
$160,000
Outstanding Balance
$96,686
Interest Rate
6.88%
Mortgage Type
Purchase Money Mortgage
Estimated Equity
$211,032
Purchase Details
Closed on
Jun 26, 2002
Sold by
Malec Brian
Bought by
Malec Karine
Home Financials for this Owner
Home Financials are based on the most recent Mortgage that was taken out on this home.
Original Mortgage
$135,000
Interest Rate
6.82%
Mortgage Type
Purchase Money Mortgage
Purchase Details
Closed on
Jun 5, 1998
Sold by
Vanderhaar Marjorie J
Bought by
Malec Brian
Home Financials for this Owner
Home Financials are based on the most recent Mortgage that was taken out on this home.
Original Mortgage
$99,900
Interest Rate
9.5%
Mortgage Type
Purchase Money Mortgage
Create a Home Valuation Report for This Property
The Home Valuation Report is an in-depth analysis detailing your home's value as well as a comparison with similar homes in the area
Home Values in the Area
Average Home Value in this Area
Purchase History
| Date | Buyer | Sale Price | Title Company |
|---|---|---|---|
| Patton Regina A | $200,000 | Midwest Title Services Llc | |
| Malec Karine | -- | First American Title | |
| Malec Brian | $111,000 | Attorneys Title Guaranty Fun |
Source: Public Records
Mortgage History
| Date | Status | Borrower | Loan Amount |
|---|---|---|---|
| Open | Patton Regina A | $160,000 | |
| Previous Owner | Malec Karine | $135,000 | |
| Previous Owner | Malec Brian | $99,900 |
Source: Public Records
Tax History Compared to Growth
Tax History
| Year | Tax Paid | Tax Assessment Tax Assessment Total Assessment is a certain percentage of the fair market value that is determined by local assessors to be the total taxable value of land and additions on the property. | Land | Improvement |
|---|---|---|---|---|
| 2024 | $4,987 | $81,399 | $14,474 | $66,925 |
| 2023 | $4,827 | $74,290 | $13,210 | $61,080 |
| 2022 | $4,259 | $65,800 | $11,700 | $54,100 |
| 2021 | $4,109 | $63,310 | $11,260 | $52,050 |
| 2020 | $4,025 | $62,170 | $11,060 | $51,110 |
| 2019 | $3,915 | $59,480 | $10,580 | $48,900 |
| 2018 | $3,626 | $55,080 | $9,800 | $45,280 |
| 2017 | $3,559 | $53,220 | $9,470 | $43,750 |
| 2016 | $3,494 | $51,300 | $9,130 | $42,170 |
| 2015 | $3,482 | $48,310 | $8,600 | $39,710 |
| 2014 | $3,466 | $46,570 | $8,290 | $38,280 |
| 2013 | $3,414 | $46,680 | $8,310 | $38,370 |
Source: Public Records
Map
Nearby Homes
- 1751 S Washington St Unit 1
- 128 E Bailey Rd Unit G
- 138 E Bailey Rd Unit M
- 158 E Bailey Rd Unit F
- 621 Bourbon Ct
- 1408 Swallow St
- 1921 Wisteria Ct Unit 3
- 517 Sheffield Rd
- 213 Winding Creek Dr
- 302 Carriage Hill Rd
- 1449 Whitespire Ct Unit 5104
- 8S452 Bell Dr
- 1443 Meander Dr
- 23 Glencoe Ct Unit 202B
- 47 Glencoe Ct Unit 102D
- 336 Brooklea Ct
- 2132 Berkley Ct Unit 201A
- 303 Cedarbrook Rd
- 221 Hampshire Ct Unit 201D
- 2279 Kaskaskia Ct
- 1655 Cove Ct Unit 2
- 1657 Cove Ct Unit 1
- 1647 Cove Ct Unit 1
- 1671 Cove Ct Unit 4
- 1645 Cove Ct Unit 2
- 1662 Cove Ct Unit 2
- 1660 Cove Ct Unit 1
- 1643 Cove Ct Unit 3
- 1664 Cove Ct Unit 3
- 1666 Cove Ct
- 1673 Cove Ct
- 1641 Cove Ct Unit 4
- 1668 Cove Ct Unit 5
- 1675 Cove Ct Unit 2
- 1670 Cove Ct Unit 1
- 1672 Cove Ct Unit 2
- 1674 Cove Ct Unit 3
- 1676 Cove Ct Unit 4
- 1630 Bay Ct Unit 1
- 1632 Swallow St